

Technical analysis
NZDUSD Wave Analysis – 03 May, 2019
May 03, 2019 @ 18:09 +03:00

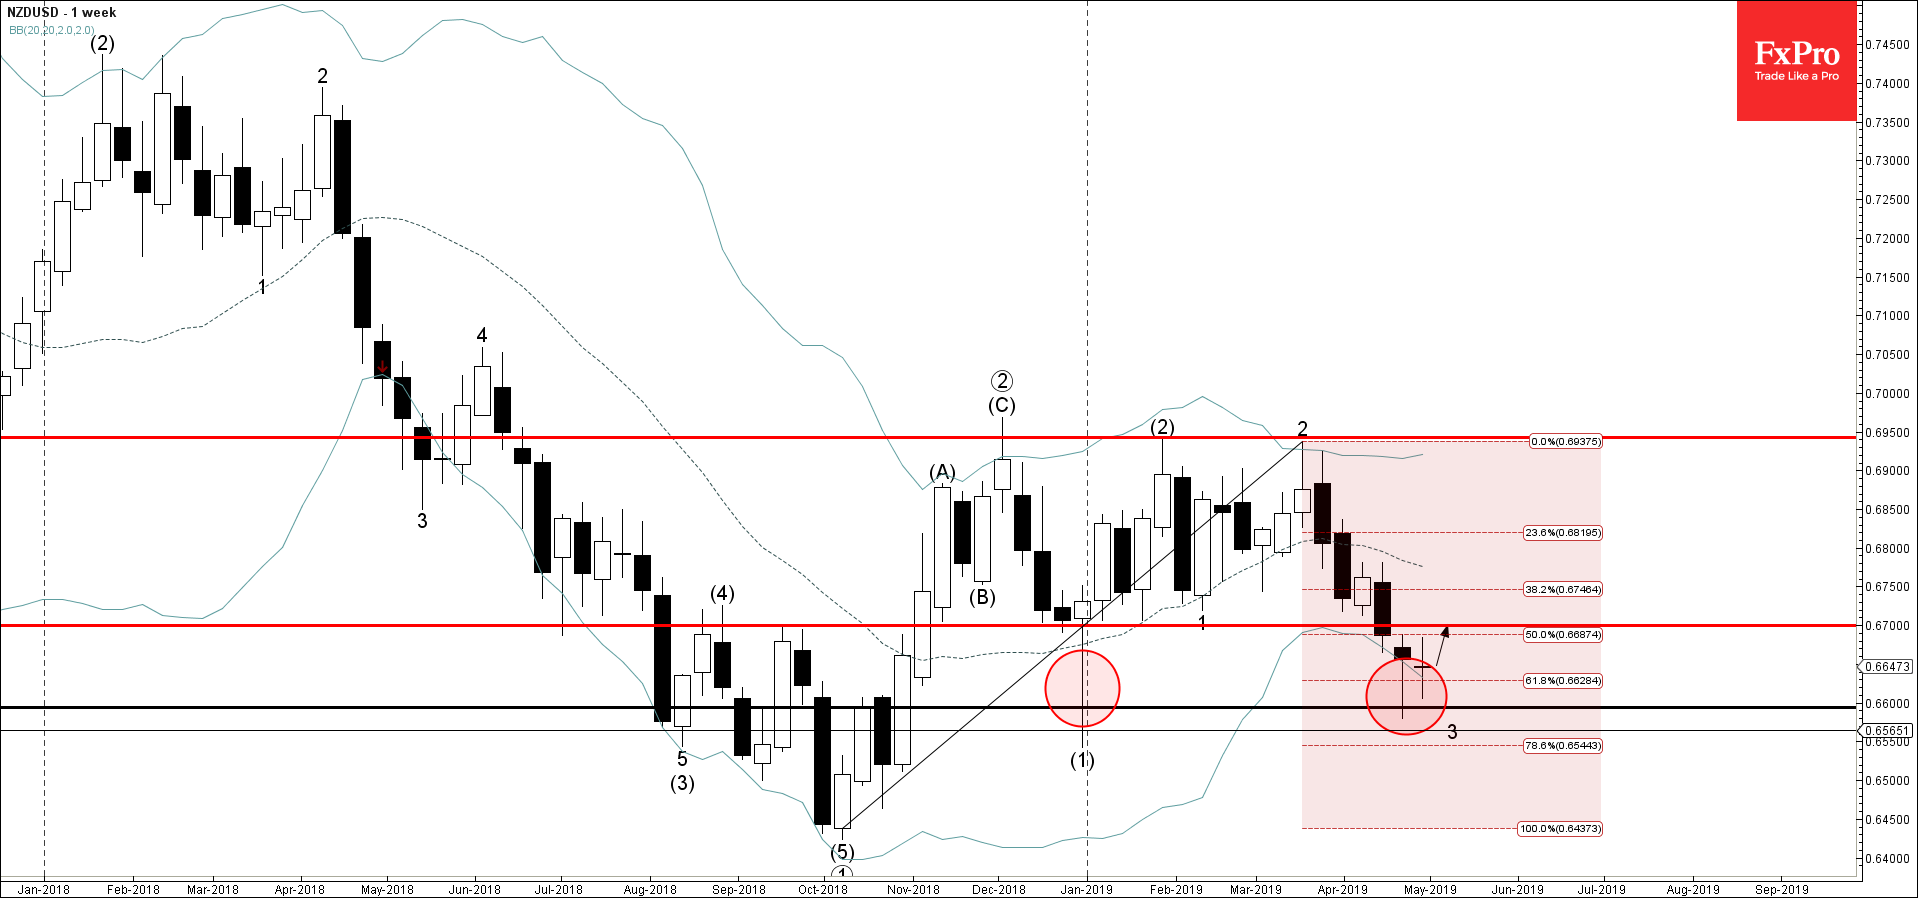
- NZDUSD reversed from support area
- Further gains are likely
NZDUSD recently reversed up from the support area lying between the key support level 0.6600 (monthly low from the end of December) and the lower daily Bollinger Band.
The upward reversal from this support area created the weekly Japanese candlesticks reversal pattern Hammer – standing outside of the lower weekly Bollinger Band.
NZDUSD is expected to rise further and re-test the next resistance level 0.6700 (former support from January).
Related Articles

Adobe Wave Analysis 3 May 2024
May 03, 2024 @ 23:02 +03:00

EURGBP Wave Analysis 3 May 2024
May 03, 2024 @ 23:01 +03:00

EURJPY Wave Analysis 2 May 2024
May 02, 2024 @ 21:07 +03:00

WTI crude oil Wave Analysis 2 May 2024
May 02, 2024 @ 21:07 +03:00