

Technical analysis
NZDCHF Wave Analysis 4 January, 2021
January 04, 2021 @ 18:38 +03:00

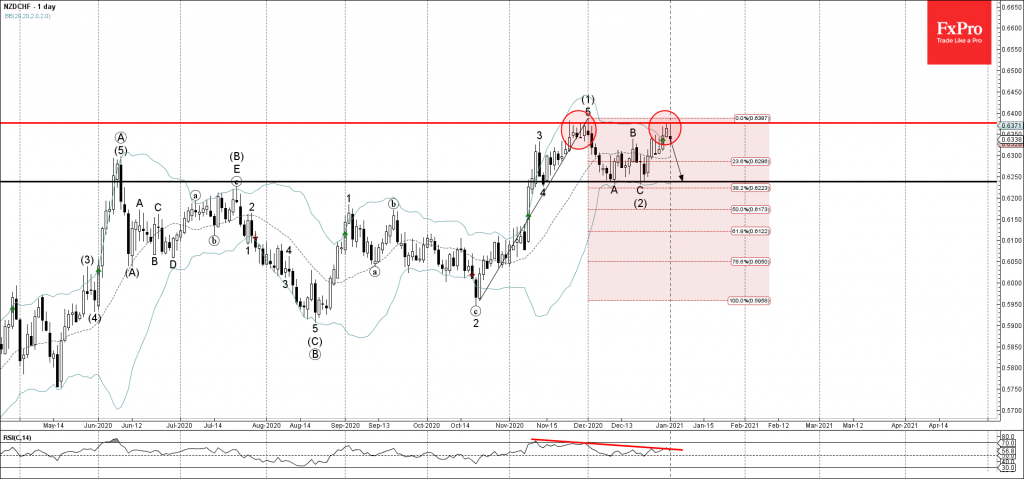
• NZDCHF reversed from resistance level 0.6375
• Likely to fall to 0.6250
NZDCHF recently reversed down strongly from the key resistance level 0.6375 (which earlier reversed the price multiple times at the end of November).
The resistance area near the resistance level 0.6375 was strengthened by the upper daily Bollinger Band.
Given the clear bearish divergence on the daily RSI indicator – NZDCHF is expected to fall further toward the next support level 0.6250 (low of the previous waves 4, A and (2)).
Related Articles

Intel Wave Analysis 19 April 2024
April 19, 2024 @ 22:12 +03:00

GBPUSD Wave Analysis 19 April 2024
April 19, 2024 @ 22:11 +03:00

EURJPY Wave Analysis 18 April 2024
April 18, 2024 @ 23:09 +03:00

EURUSD Wave Analysis 18 April 2024
April 18, 2024 @ 23:08 +03:00