

Technical analysis
NZDCHF Wave Analysis – 28 February, 2019
February 28, 2019 @ 18:44 +03:00

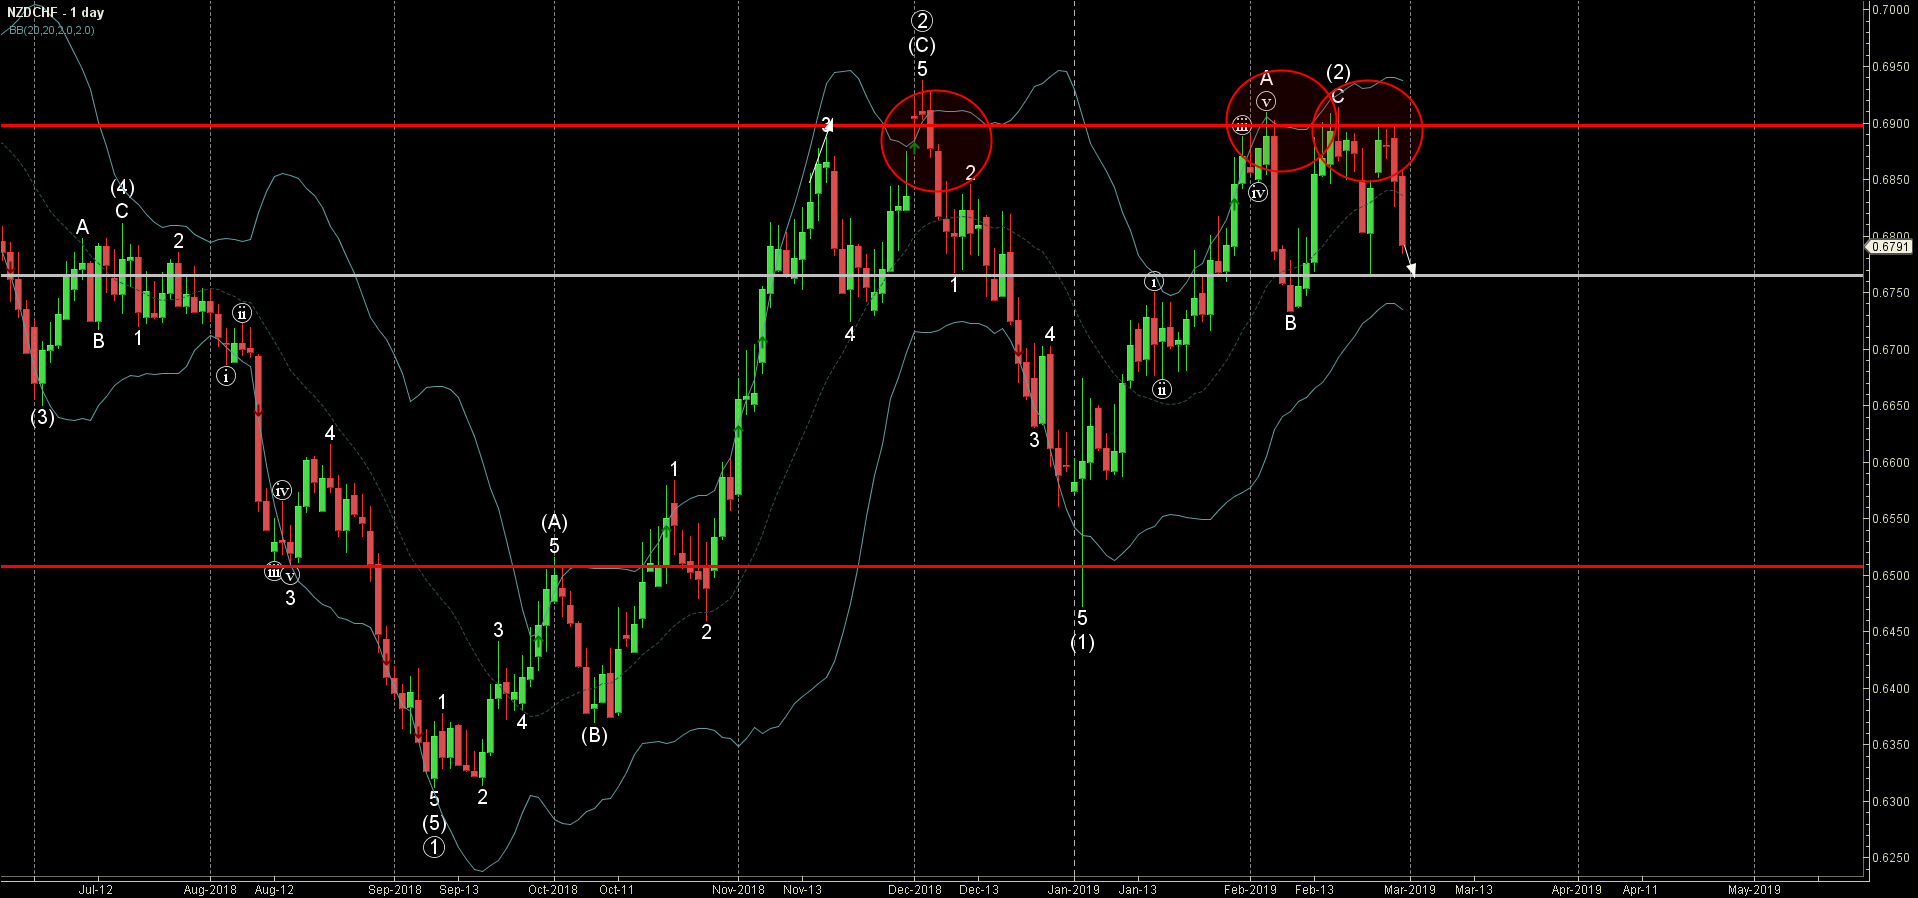
- NZDCHF reversed from resistance area
- Further losses are likely
NZDCHF recently reversed down from the resistance area lying between the key resistance level 0.6900 (which has been revering the price from December) and the upper daily Bollinger Band.
The downward reversal from this resistance area created the daily Japanese candlesticks reversal pattern Evening Star.
NZDCHF is expected to fall further and re-test the next support level 0.6760.
Related Articles

WTI crude oil Wave Analysis 8 May 2024
May 08, 2024 @ 23:23 +03:00

AUDJPY Wave Analysis 8 May 2024
May 08, 2024 @ 23:22 +03:00

S&P 500 Wave Analysis 7 May 2024
May 07, 2024 @ 22:06 +03:00

USDCHF Wave Analysis 7 May 2024
May 07, 2024 @ 22:05 +03:00