

Technical analysis
NZDCHF Wave Analysis – 10 April, 2020
April 10, 2020 @ 17:26 +03:00

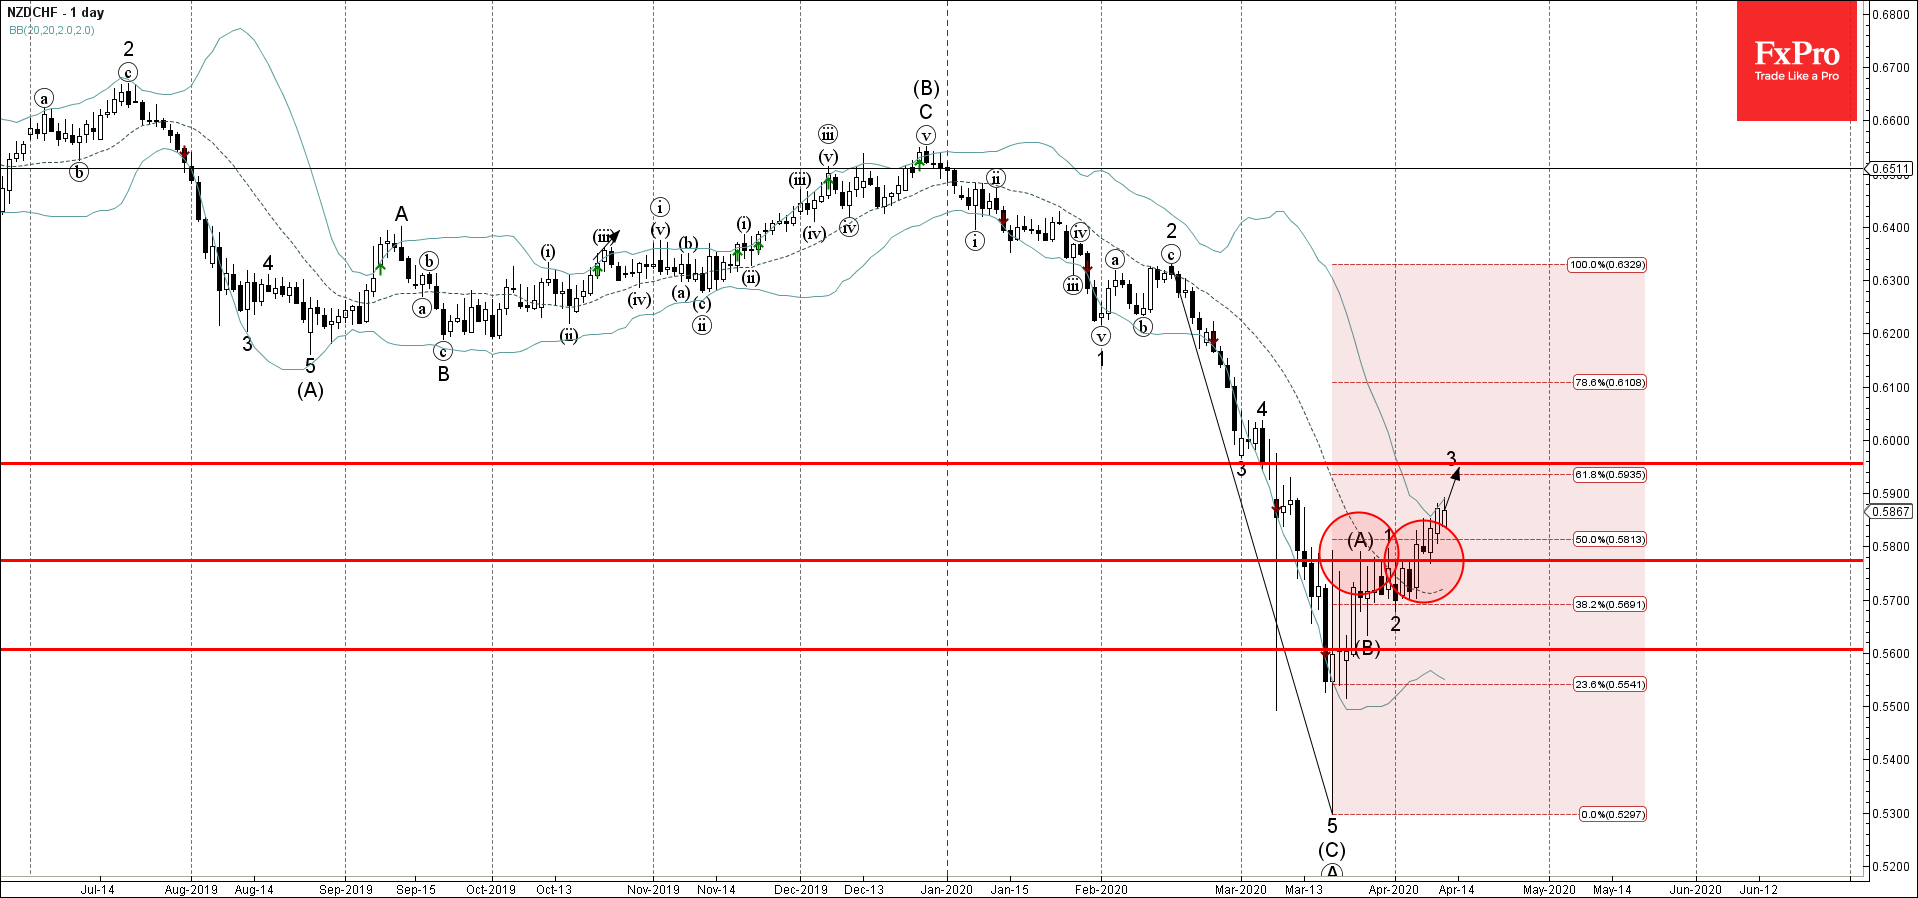
- NZDCHF broke resistance level 0.5800
- Likely to rise to 0.5955
NZDCHF recently broke the key resistance level 0.5800 (which reversed the previous waves (A) and 1, as can be seen from the daily NZDCHF chart below).
The breakout of the resistance level 0.5800 coincided with the breakout of the 50% Fibonacci correction of the previous sharp downward impulse wave from February.
NZDCHF is likely to rise further inside the active impulse wave 3 toward the next resistance level 0.5955 (target price for the completion of this impulse wave).
Related Articles

EURGBP Wave Analysis 24 April 2024
April 24, 2024 @ 21:42 +03:00

EURJPY Wave Analysis 24 April 2024
April 24, 2024 @ 21:40 +03:00

WTI crude oil Wave Analysis 23 April 2024
April 23, 2024 @ 22:47 +03:00

USDCAD Wave Analysis 23 April 2024
April 23, 2024 @ 22:46 +03:00