

Technical analysis
NZDCHF Wave Analysis – 05 November , 2018
November 05, 2018 @ 14:59 +03:00
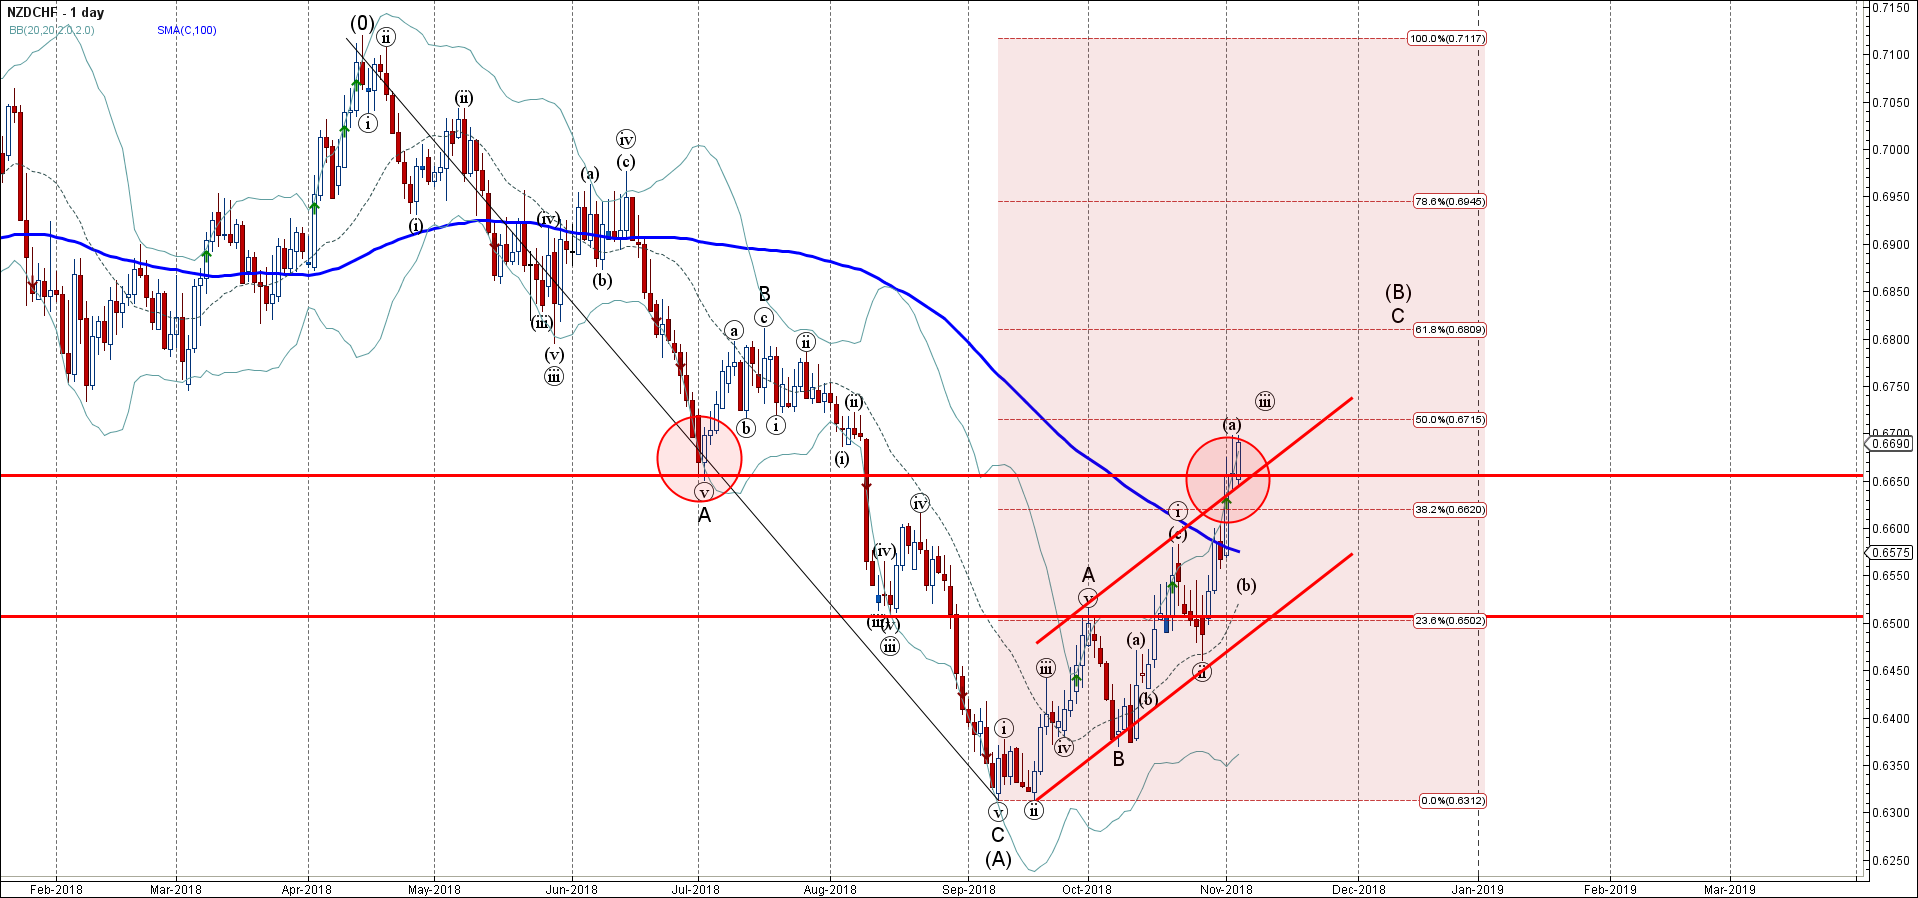
- NZDCHF broke resistance area
- Further gains are likely
NZDCHF continues to rise inside after the earlier breakout of the resistance area lying between the resistance level 0.6650 (former support from July), daily up channel from September, 100-day moving average and the 38.2% Fibonacci correction of the previous downward impulse from April.
The breakout of this resistance area accelerated the active short-term impulse wave C – which belongs to the medium-term ABC correction (B) from September.
NZDCHF is expected to rise further and re-test the next resistance level 0.6750. Strong support now stands at 0.6650.
Related Articles

GBPCAD Wave Analysis 25 April 2024
April 25, 2024 @ 20:10 +03:00

GBPAUD Wave Analysis 25 April 2024
April 25, 2024 @ 20:09 +03:00

EURGBP Wave Analysis 24 April 2024
April 24, 2024 @ 21:42 +03:00

EURJPY Wave Analysis 24 April 2024
April 24, 2024 @ 21:40 +03:00