

Technical analysis
NZDCAD Wave Analysis 8 October, 2020
October 08, 2020 @ 17:47 +03:00

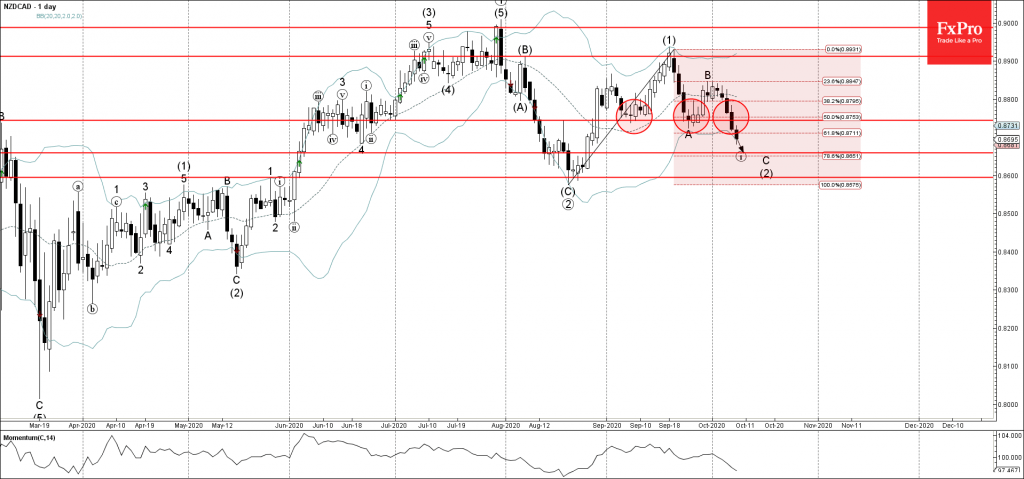
• NZDCAD broke support zone
• Likely to fall to 0.8660
NZDCAD recently broke the support zone lying between the key support level 0.8750 and the 50% Fibonacci correction of the upward impulse wave (1) from August.
The breakout of this support zone accelerated the active downward impulse wave C of the ABC correction (2) from last month.
NZDCAD is likely to fall further toward the next support level 0.8660 (target price for the completion of the active sub-impulse wave (i)).
Related Articles

EURGBP Wave Analysis 24 April 2024
April 24, 2024 @ 21:42 +03:00

EURJPY Wave Analysis 24 April 2024
April 24, 2024 @ 21:40 +03:00

WTI crude oil Wave Analysis 23 April 2024
April 23, 2024 @ 22:47 +03:00

USDCAD Wave Analysis 23 April 2024
April 23, 2024 @ 22:46 +03:00