

Technical analysis
NZDCAD Wave Analysis 29 September, 2020
September 29, 2020 @ 17:18 +03:00

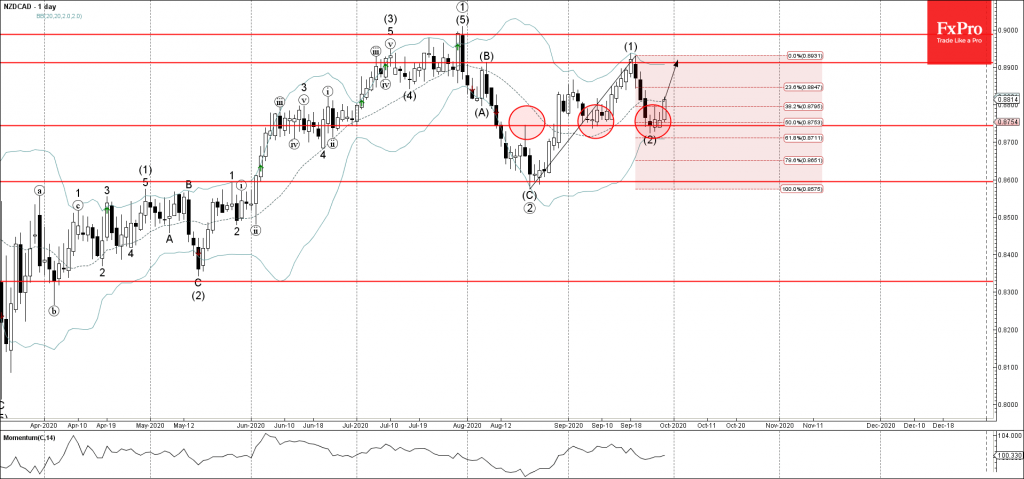
• NZDCAD reversed from support area
• Likely to rise to 0.8900
NZDCAD recently reversed up from the support area located between the pivotal support level 0.8745 (which has been reversing the price from the middle of August), lower daily Bollinger Band and the 50% Fibonacci retracement of the upward impulse (1) from last month.
The upward reversal from this support area stopped the previous medium-term ABC correction (2).
NZDCAD is likely to rise further toward the next resistance level 0.8900 (top of the previous medium-term impulse wave (1)).
Related Articles

S&P 500 Wave Analysis 7 May 2024
May 07, 2024 @ 22:06 +03:00

USDCHF Wave Analysis 7 May 2024
May 07, 2024 @ 22:05 +03:00

USDJPY Wave Analysis 6 May 2024
May 06, 2024 @ 21:30 +03:00

Gold Wave Analysis 6 May 2024
May 06, 2024 @ 21:30 +03:00