

Technical analysis
NZDCAD Wave Analysis – 27 April, 2020
April 27, 2020 @ 17:26 +03:00

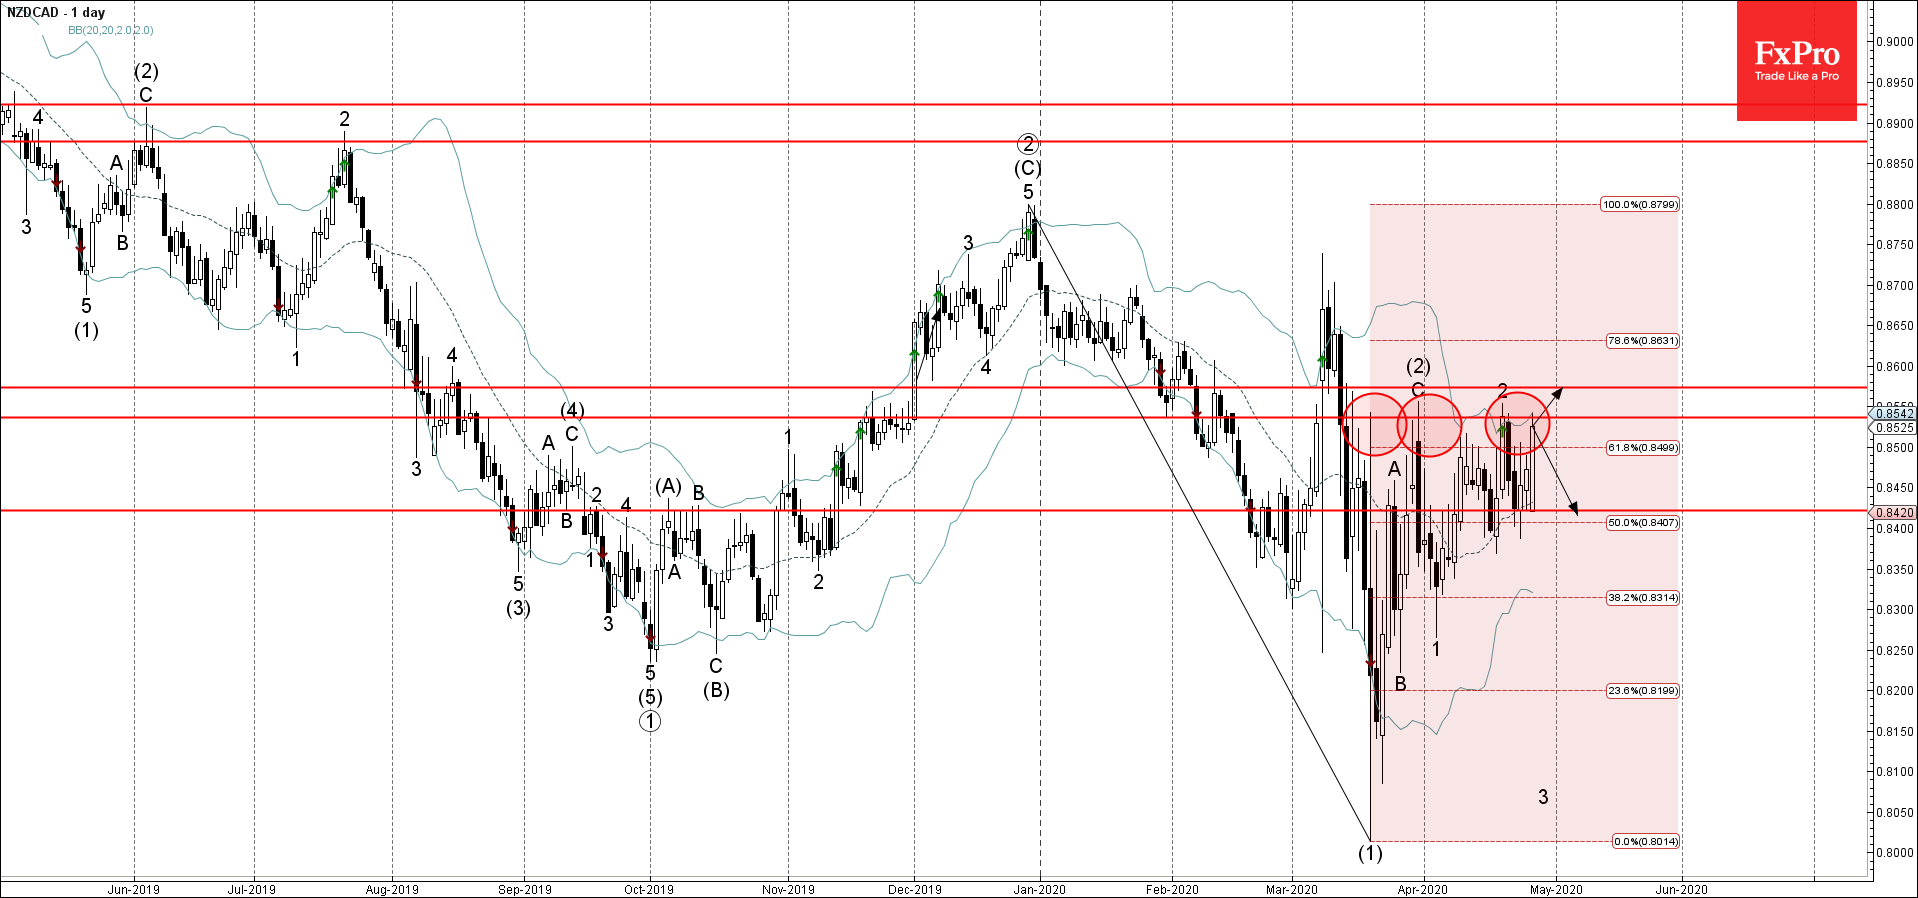
- NZDCAD reversed from pivotal resistance level 0.8535
- Likely to fall to 0.8420
NZDCAD recently reversed down from the pivotal resistance level 0.8535 (which has been reversing the price from the middle of March).
The resistance zone near the resistance level 0.8535 was strengthened by the upper daily Bollinger Band and by the 61.8% Fibonacci correction of the previous downward impulse wave (1).
NZDCAD is expected to fall further toward the next support level 0.8420. Nearby resistance stands at the resistance level 0.8570.
Related Articles

GBPCAD Wave Analysis 25 April 2024
April 25, 2024 @ 20:10 +03:00

GBPAUD Wave Analysis 25 April 2024
April 25, 2024 @ 20:09 +03:00

EURGBP Wave Analysis 24 April 2024
April 24, 2024 @ 21:42 +03:00

EURJPY Wave Analysis 24 April 2024
April 24, 2024 @ 21:40 +03:00