

Technical analysis
NZDCAD Wave Analysis – 26 August, 2020
August 26, 2020 @ 17:50 +03:00

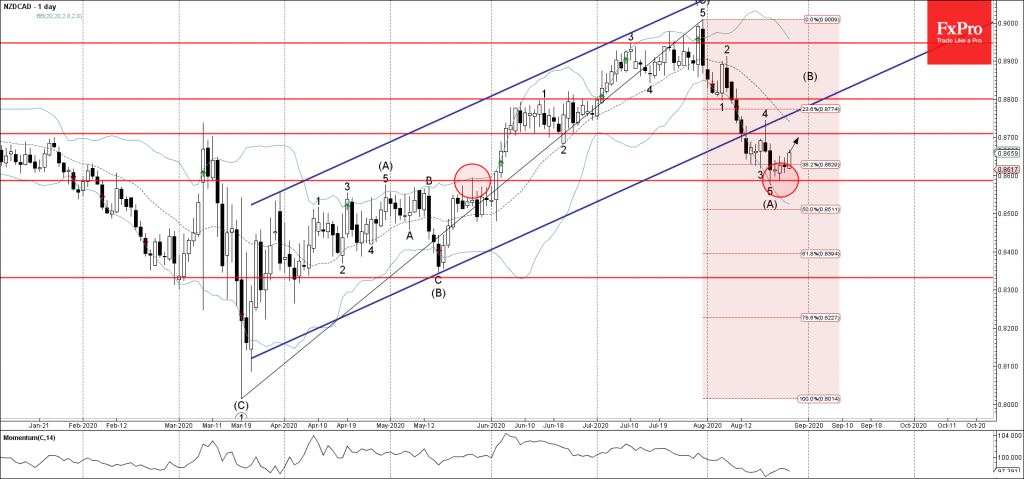
• NZDCAD reversed from support level 0.8595
• Likely to rise to 0.8700
NZDCAD recently reversed up from the support level 0.8595 (former resistance from May) – standing near the lower daily Bollinger Band.
The support zone near the support level 0.8595 was strengthened by the 38.2% Fibonacci correction level of the previous extended upward price move from last March.
NZDCAD is likely to rise further toward the next resistance level 0.8700 (former support level from June – which stopped previous correction 4).
Related Articles

GBPCAD Wave Analysis 25 April 2024
April 25, 2024 @ 20:10 +03:00

GBPAUD Wave Analysis 25 April 2024
April 25, 2024 @ 20:09 +03:00

EURGBP Wave Analysis 24 April 2024
April 24, 2024 @ 21:42 +03:00

EURJPY Wave Analysis 24 April 2024
April 24, 2024 @ 21:40 +03:00