

Technical analysis
NZDCAD Wave Analysis – 25 March, 2019
March 25, 2019 @ 18:11 +03:00

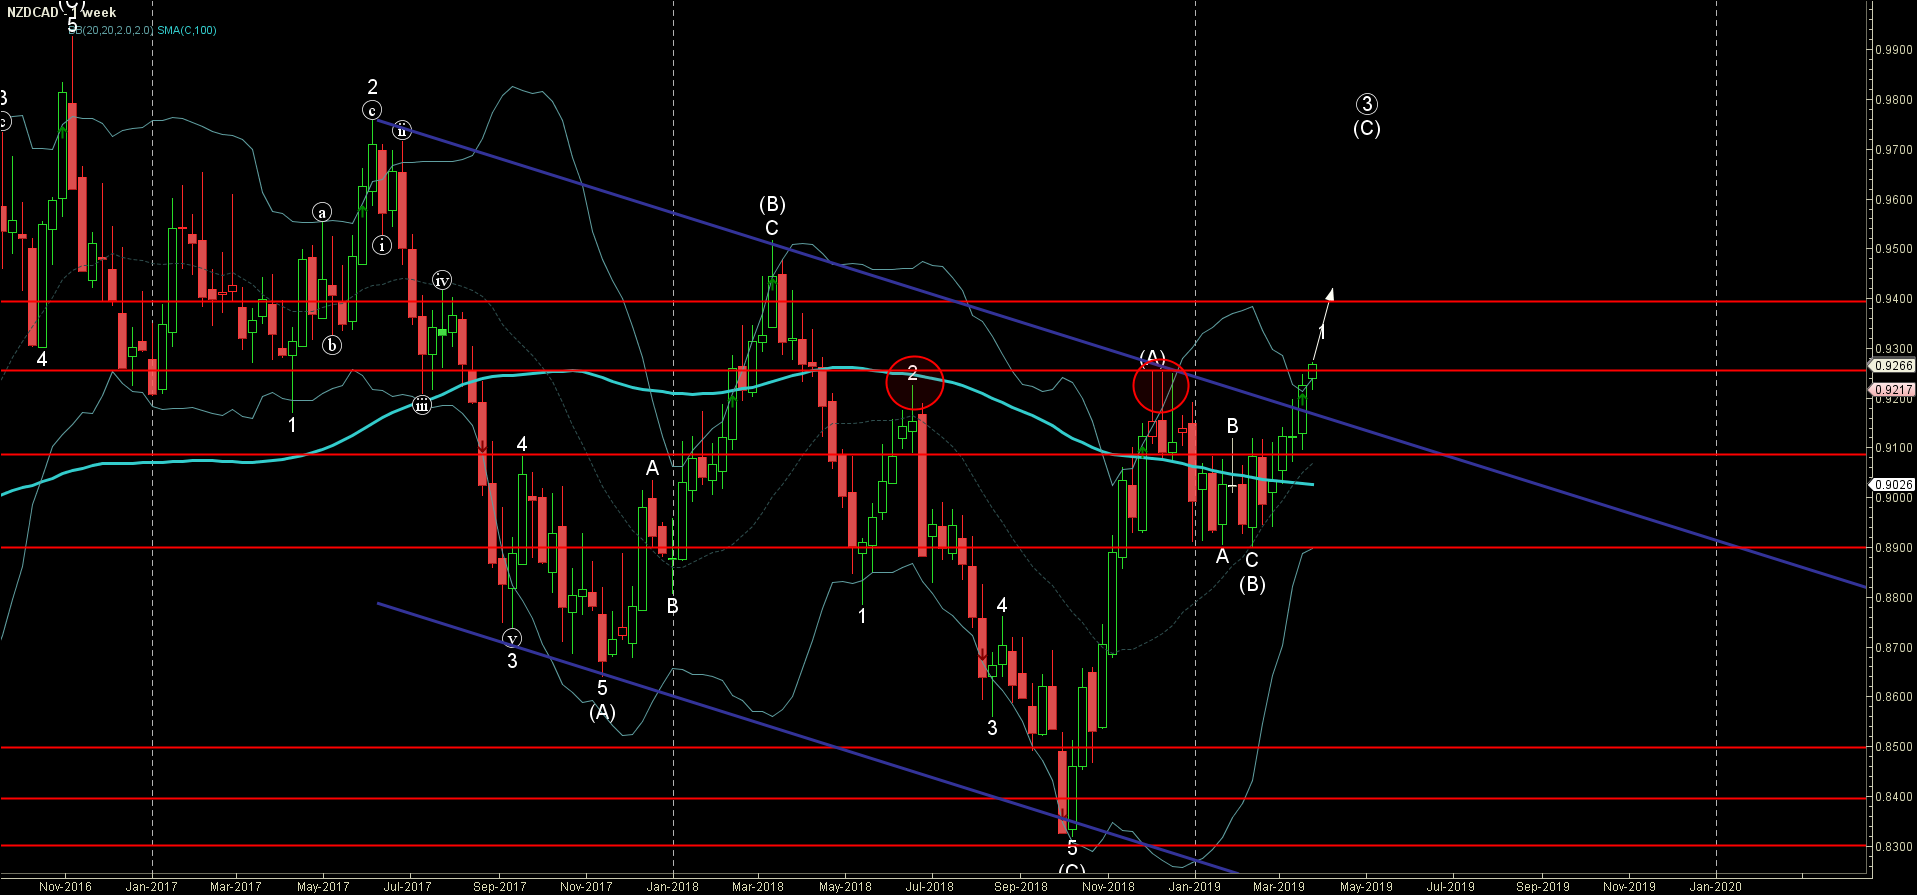
- NZDCAD broke resistance area
- Further gains are likely
NZDCAD recently broke through the resistance area lying between the key resistance level 0.9250 (monthly high from November) and the resistance trendline of the wide weekly down channel from the middle of May.
The breakout of this resistance area accelerated the active medium-term impulse wave (C) from the strong support level 0.8900.
NZDCAD is expected rise further and re-test the next resistance level 0.9500 (top of the previous correction (B) from 2018).
Related Articles

GBPCAD Wave Analysis 25 April 2024
April 25, 2024 @ 20:10 +03:00

GBPAUD Wave Analysis 25 April 2024
April 25, 2024 @ 20:09 +03:00

EURGBP Wave Analysis 24 April 2024
April 24, 2024 @ 21:42 +03:00

EURJPY Wave Analysis 24 April 2024
April 24, 2024 @ 21:40 +03:00