

Technical analysis
NZDCAD Wave Analysis 24 March, 2021
March 24, 2021 @ 18:42 +03:00

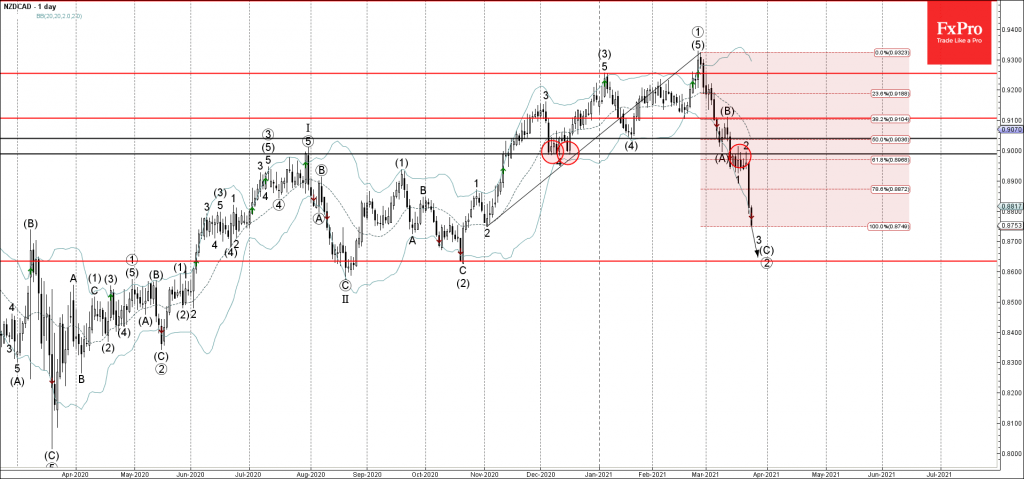
• NZDCAD falling inside sharp impulse wave 3
• Likely to reach support level 0.8635
NZDCAD continues to fall inside the sharp impulse wave 3 which started earlier from the resistance zone lying between the resistance level 0.900 (former support from December) and the 61.8% Fibonacci correction of the upward impulse from November.
The active impulse wave 3 belongs to the intermediate impulse sequence (C) from the start of March.
NZDCAD is likely to fall further toward the next support level 0.8635 (multi-month low from October and the target price for the completion of the active impulse wave (C)).
Related Articles

EURGBP Wave Analysis 24 April 2024
April 24, 2024 @ 21:42 +03:00

EURJPY Wave Analysis 24 April 2024
April 24, 2024 @ 21:40 +03:00

WTI crude oil Wave Analysis 23 April 2024
April 23, 2024 @ 22:47 +03:00

USDCAD Wave Analysis 23 April 2024
April 23, 2024 @ 22:46 +03:00