

Technical analysis
NZDCAD Wave Analysis – 19 March, 2020
March 19, 2020 @ 17:49 +03:00

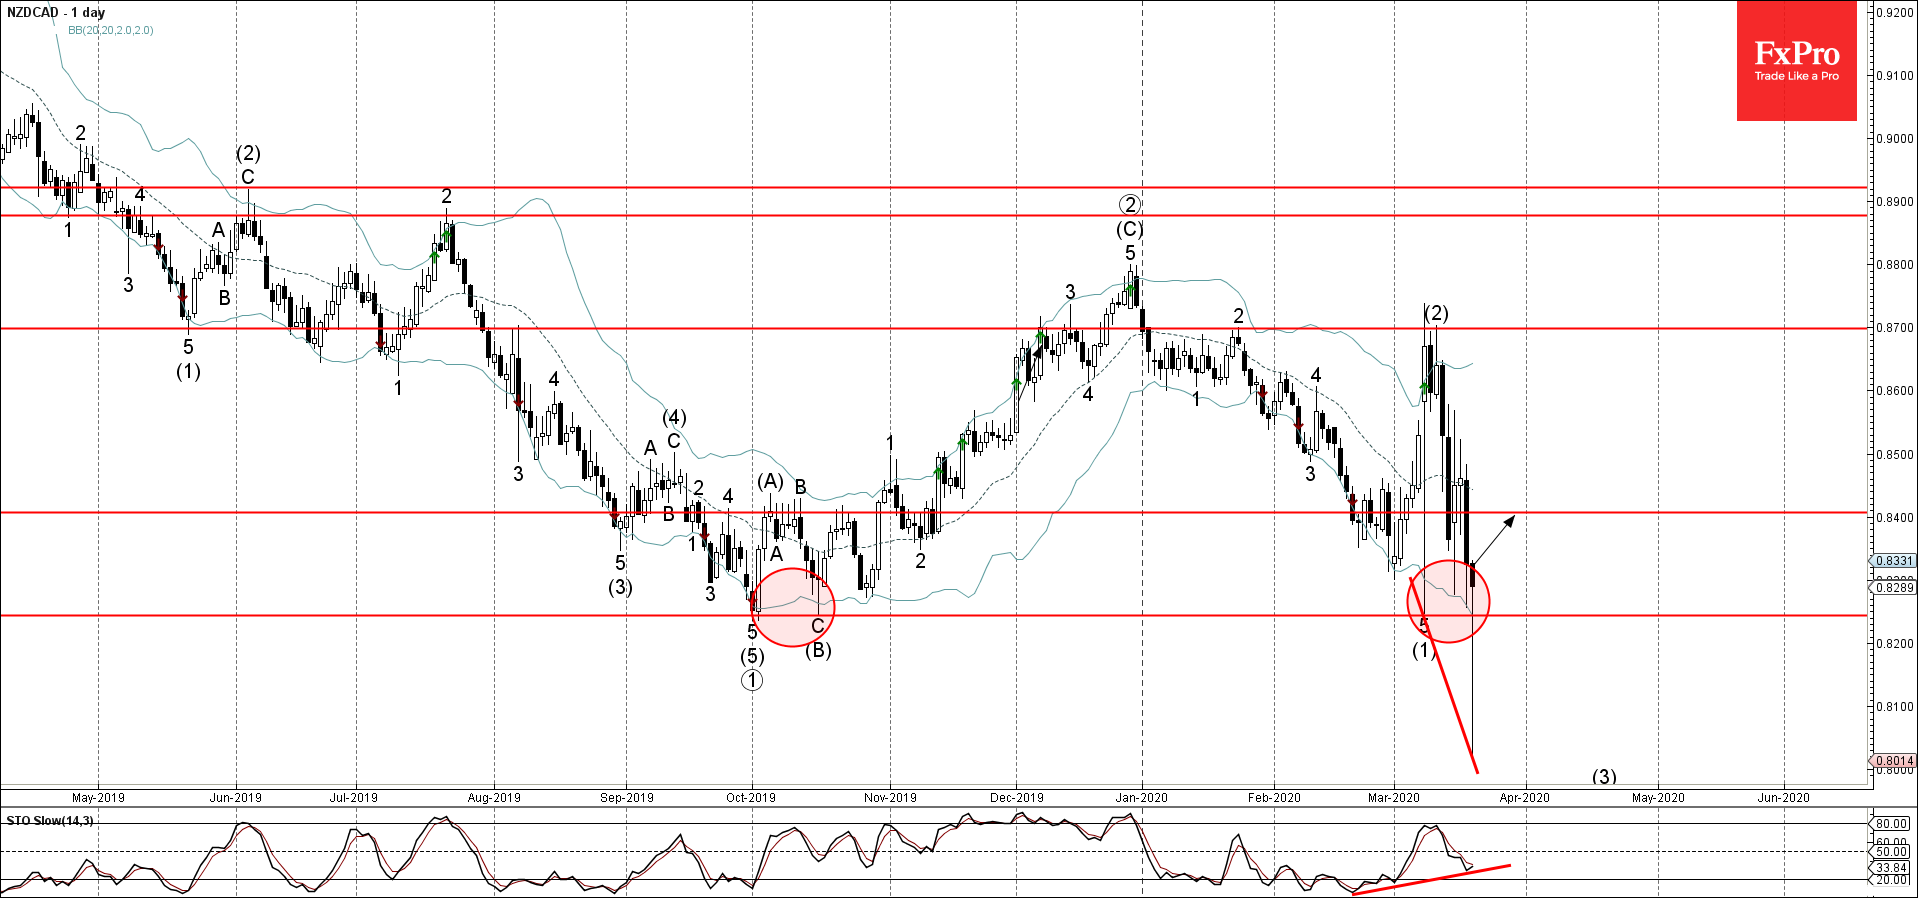
- NZDCAD reversed from pivotal support level 0.8240
- Likely to rise to 0.8400
NZDCAD recently reversed up from the pivotal support level 0.8240 (which has been reversing the price from last October) – strengthened by the lower daily Bollinger Band.
The upward reversal from the support level 0.8240 stopped the earlier impulse wave (3) – which started earlier from the key resistance level 0.8700.
With the clear bullish divergence on the daily Stochastic indicator – NZDCAD is likely to rise further toward the next resistance level 0.8400.
Related Articles

EURJPY Wave Analysis 18 April 2024
April 18, 2024 @ 23:09 +03:00

EURUSD Wave Analysis 18 April 2024
April 18, 2024 @ 23:08 +03:00

WTI Wave Analysis 17 April 2024
April 17, 2024 @ 22:40 +03:00

EURGBP Wave Analysis 17 April 2024
April 17, 2024 @ 22:38 +03:00