

Technical analysis
NZDCAD Wave Analysis 16 April, 2021
April 16, 2021 @ 17:48 +03:00

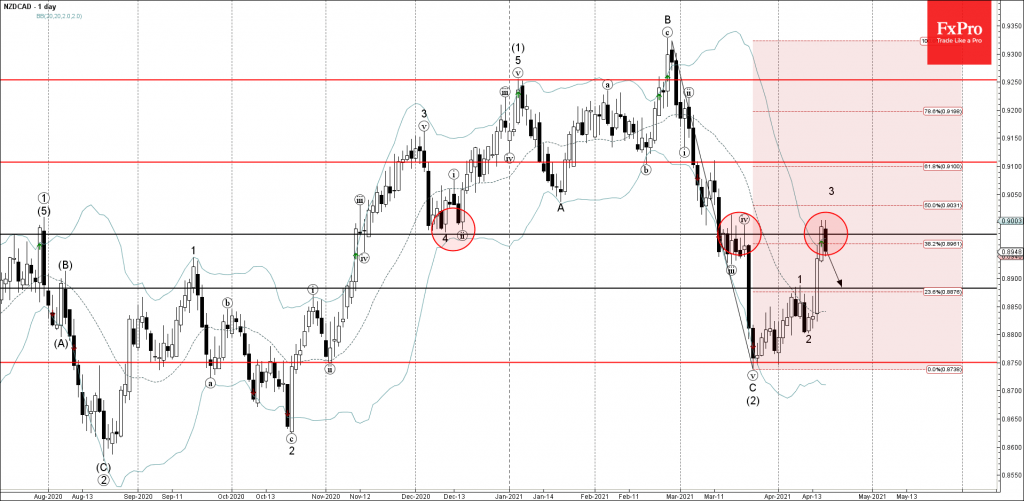
• NZDCAD reversed from resistance level 0.8980
• Likely to fall to support level 0.8885
NZDCAD currency pair recently reversed down from the resistance level 0.8980 (former strong support from the start of December) intersecting with the upper daily Bollinger Band and the 38.2% Fibonacci correction of the downward impulse from February.
The downward reversal from the resistance level 0.8980 stopped the previous minor impulse wave 3.
NZDCAD is likely to fall further toward the next support level 0.8885 (top of the impulse wave 1 from the start of April).
Related Articles

Intel Wave Analysis 19 April 2024
April 19, 2024 @ 22:12 +03:00

GBPUSD Wave Analysis 19 April 2024
April 19, 2024 @ 22:11 +03:00

EURJPY Wave Analysis 18 April 2024
April 18, 2024 @ 23:09 +03:00

EURUSD Wave Analysis 18 April 2024
April 18, 2024 @ 23:08 +03:00