

Technical analysis
NZDCAD Wave Analysis – 13 May, 2020
May 13, 2020 @ 19:01 +03:00

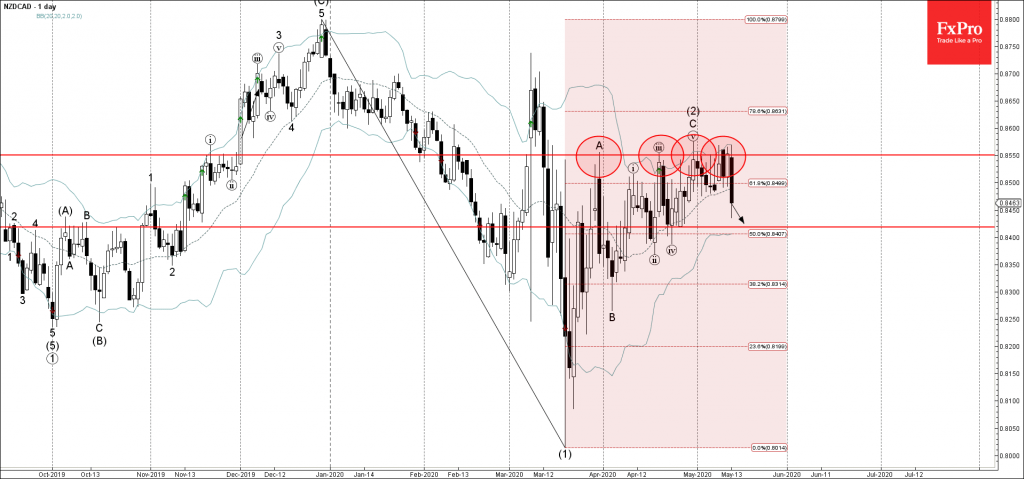
• NZDCAD reversed from resistance area
• Likely to fall to 0.8420
NZDCAD recently reversed down from the resistance area lying between the resistance level 0.8550 (which has been reversing the price from the middle of March), upper daily Bollinger Band and the 61.8% Fibonacci correction of the previous downward impulse from December.
The downward reversal from this resistance area is in the process of forming the second consecutive candlestick pattern Bearish Engulfing.
NZDCAD is expected to fall further toward the next support level 0.8420.
Related Articles

GBPCAD Wave Analysis 25 April 2024
April 25, 2024 @ 20:10 +03:00

GBPAUD Wave Analysis 25 April 2024
April 25, 2024 @ 20:09 +03:00

EURGBP Wave Analysis 24 April 2024
April 24, 2024 @ 21:42 +03:00

EURJPY Wave Analysis 24 April 2024
April 24, 2024 @ 21:40 +03:00