

Technical analysis
NZDCAD Wave Analysis – 12 June, 2020
June 12, 2020 @ 17:31 +03:00

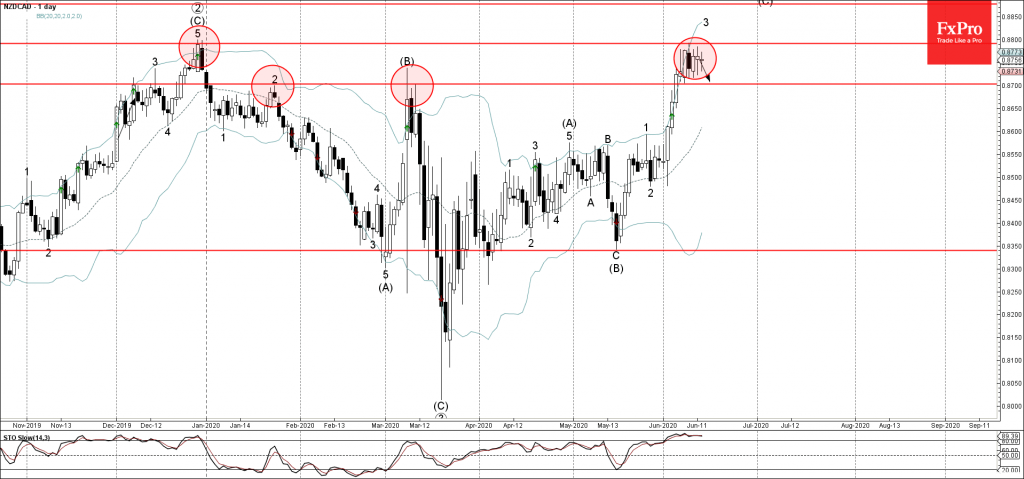
• NZDCAD reversed from resistance zone
• Likely to fall to 0.8700
NZDCAD recently reversed down from the resistance zone located between the key resistance level 0,8800 (which stopped the sharp impulse wave (C) in December) and the upper daily Bollinger Band.
The downward reversal from this resistance zone stopped the earlier impulse waves 3 and (C).
NZDCAD is likely to fall further toward the next support level 0.8700 (former strong resistance from the January and March, acting as support after it was broken previously).
Related Articles

EURJPY Wave Analysis 18 April 2024
April 18, 2024 @ 23:09 +03:00

EURUSD Wave Analysis 18 April 2024
April 18, 2024 @ 23:08 +03:00

WTI Wave Analysis 17 April 2024
April 17, 2024 @ 22:40 +03:00

EURGBP Wave Analysis 17 April 2024
April 17, 2024 @ 22:38 +03:00