

Technical analysis
NZDCAD reversed from resistance area
December 07, 2018 @ 17:50 +03:00

- NZDCAD reversed from resistance area
- Further losses are likely
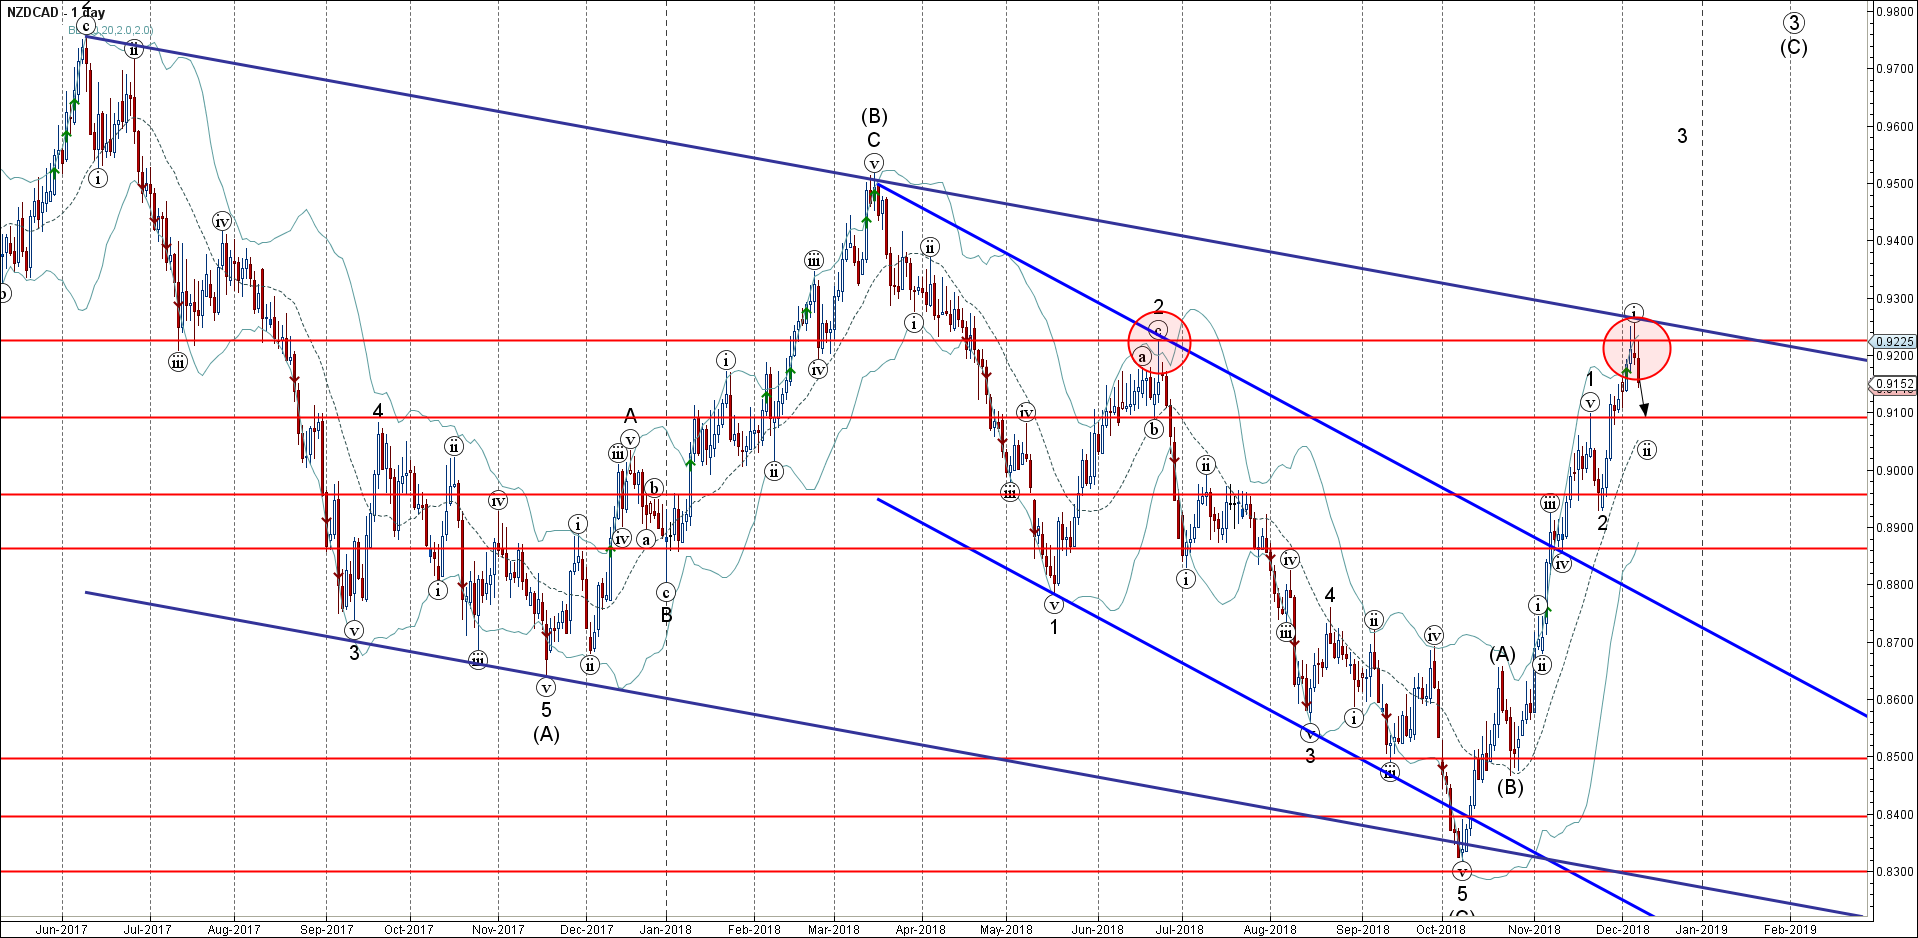
NZDCAD recently reversed down sharply from the resistance area lying between the through the strong resistance level 0.9220 (multi-month high from May), upper daily Bollinger Band and the resistance trendline of the weekly down channel from June of 2017.
The downward reversal from this resistance area started the active short–term corrective wave (ii) – which belongs to the medium-term impulse wave (C) from the start of October.
NZDCAD is expected to fall further and re-test the next support level 0.9100 (former resistance level from November and the top of the previous impulse wave 1).
Related Articles

GBPAUD Wave Analysis 24 April 2024
April 25, 2024 @ 20:09 +03:00

EURGBP Wave Analysis 24 April 2024
April 24, 2024 @ 21:42 +03:00

EURJPY Wave Analysis 24 April 2024
April 24, 2024 @ 21:40 +03:00

WTI crude oil Wave Analysis 23 April 2024
April 23, 2024 @ 22:47 +03:00