

Technical analysis
NTGUSD Wave Analysis – 14 February, 2019
February 14, 2019 @ 17:45 +03:00

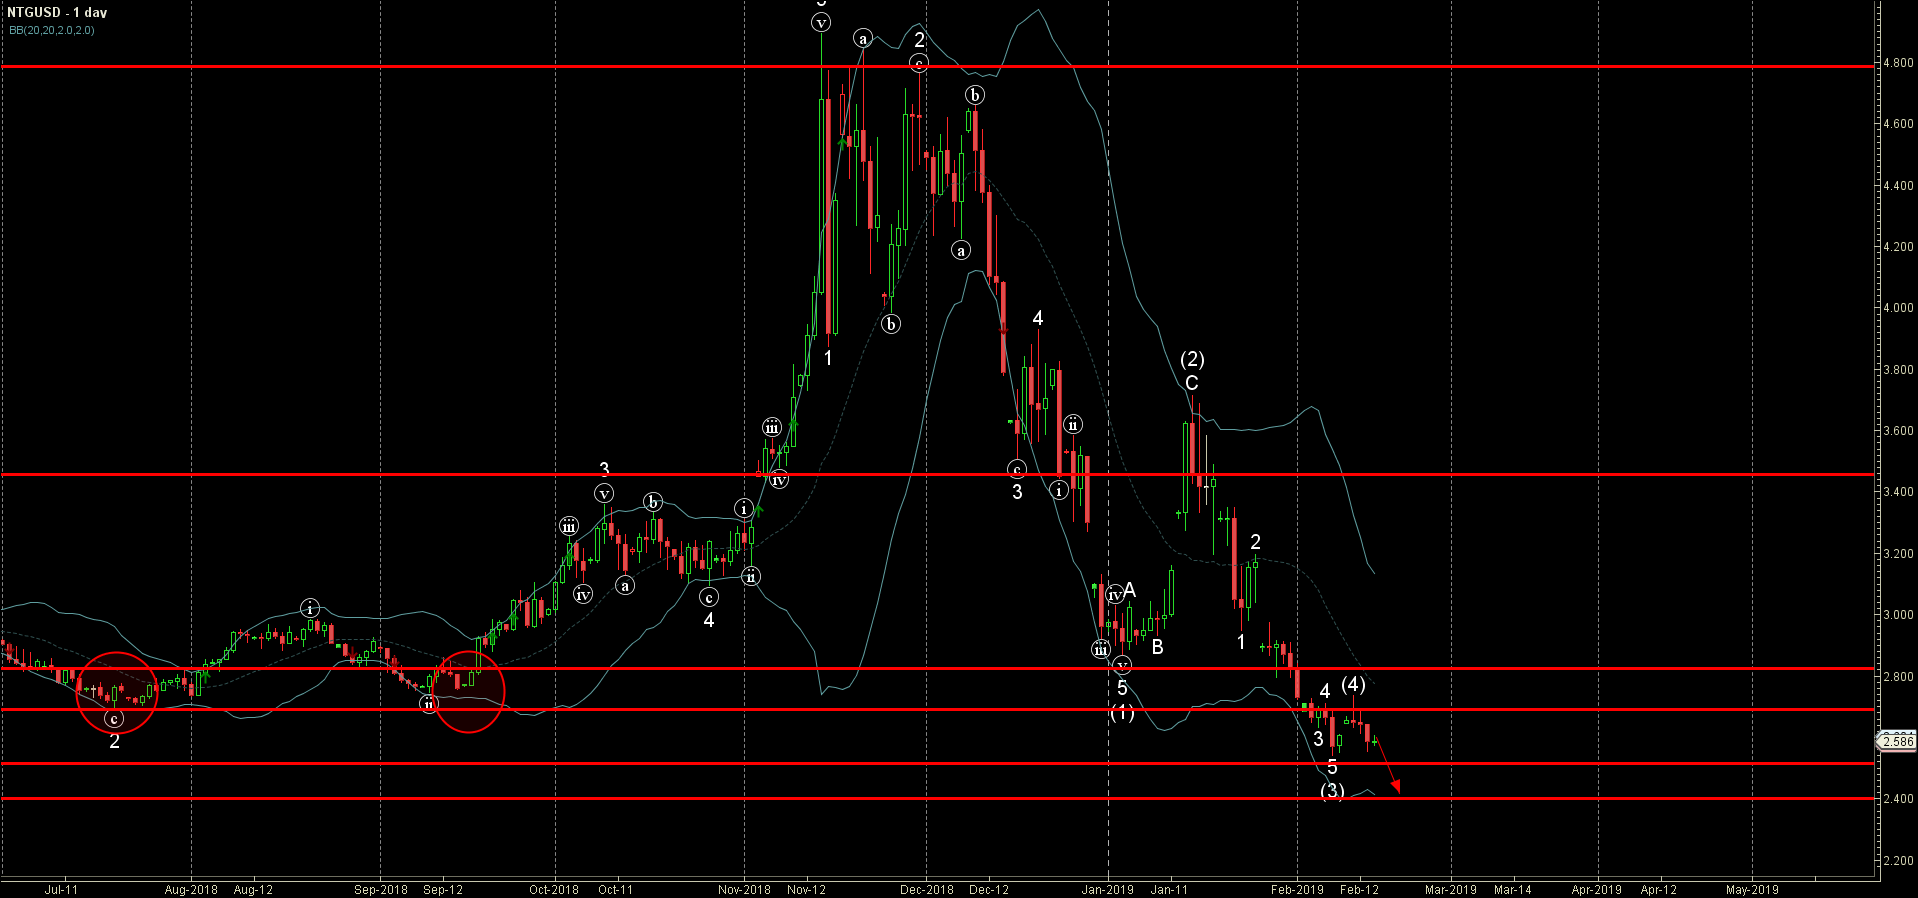
- NTGUSD reversed from resistance level 2.690
- Further losses are likely
NTGUSD recently reversed down from the resistance level 2.690 (former multi-month support level from last year, acting as resistance after it was broken by the previous impulse wave (3)).
The downward reversal from this resistance level created the daily Japanese candlesticks reversal pattern Shooting Star – which marked the start of the active impulse wave (5).
NTGUSD is expected to fall further and re-test the next support level 2.510 (low of wave (3)) – the breakout of which can lead to further losses toward 2.400.
Related Articles

WTI crude oil Wave Analysis 23 April 2024
April 23, 2024 @ 22:47 +03:00

USDCAD Wave Analysis 23 April 2024
April 23, 2024 @ 22:46 +03:00

Intel Wave Analysis 19 April 2024
April 19, 2024 @ 22:12 +03:00

GBPUSD Wave Analysis 19 April 2024
April 19, 2024 @ 22:11 +03:00