

Technical analysis
Natural Gas Wave Analysis – 21 February, 2020
February 21, 2020 @ 16:53 +03:00

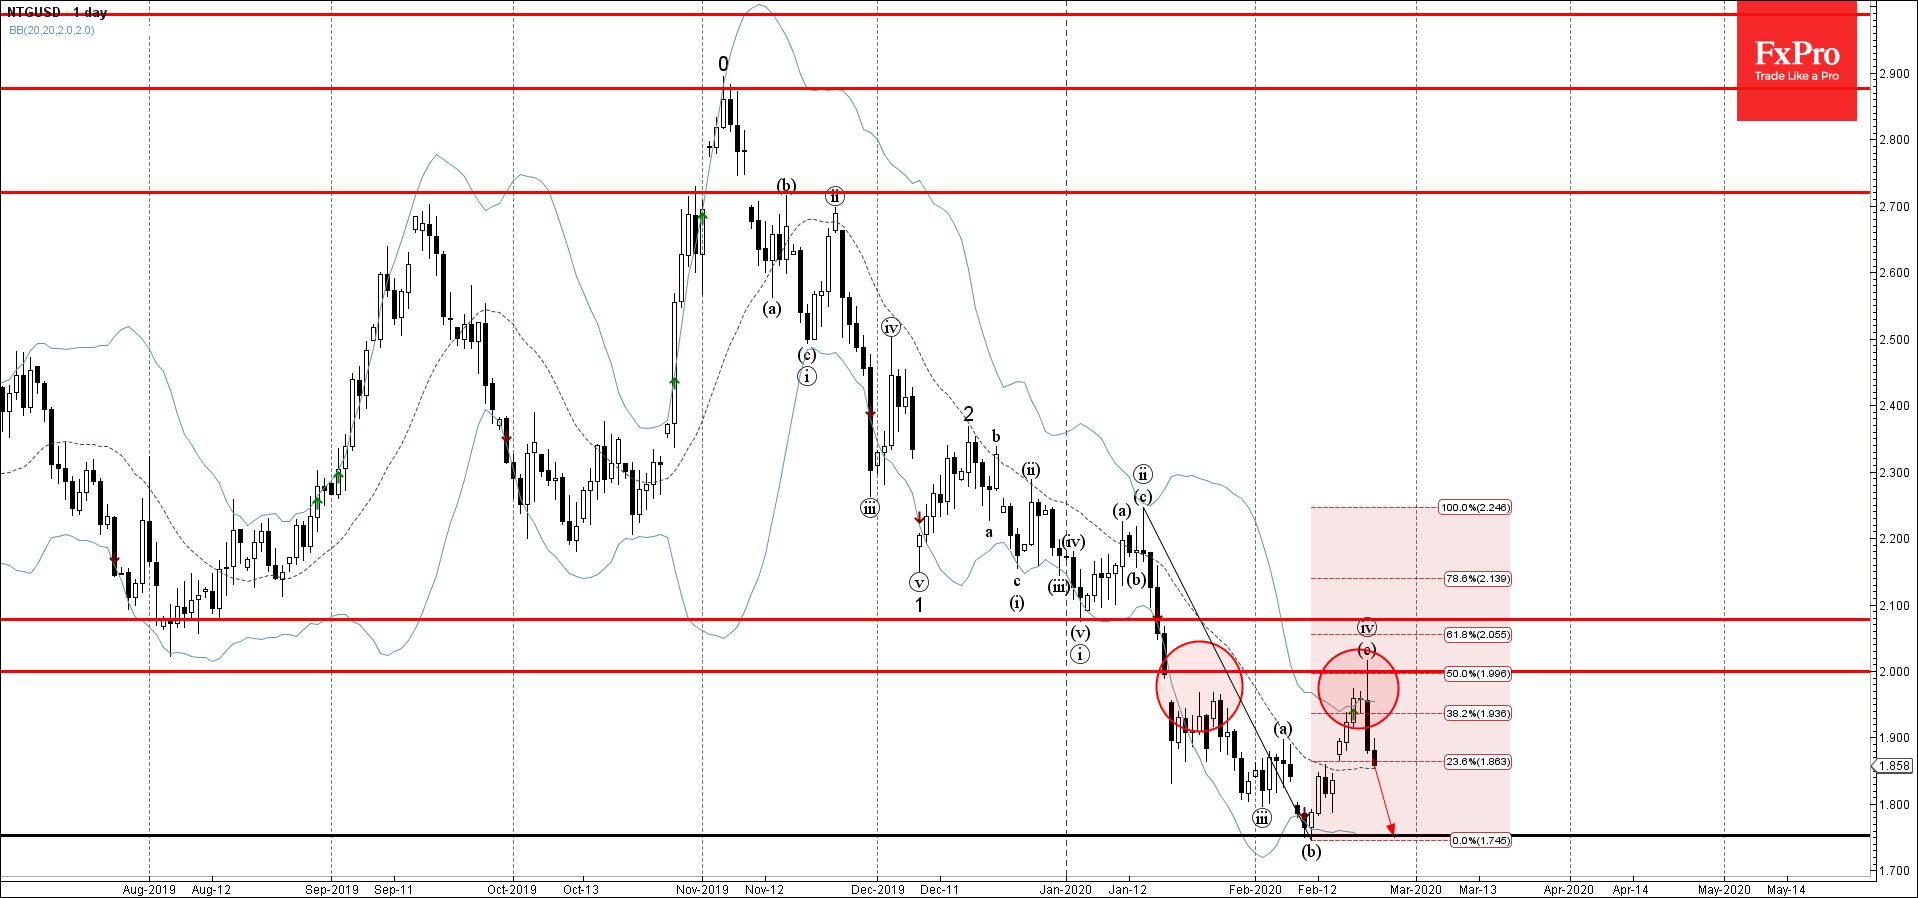
- Natural Gas reversed from resistance area
- Likely to fall to 1.7530
Natural Gas recently reversed down sharply from the resistance area lying between the round resistance level 2.000, upper daily Bollinger Band and the 50% Fibonacci retracement of the previous sharp downward impulse from January.
The downward reversal from this resistance area created the daily reversal pattern Evening Star – which started the active impulse wave (v).
Natural Gas is likely to fall further toward the next support level 1.7530 (low of the previous wave (b) from the start of February).
Related Articles

Intel Wave Analysis 19 April 2024
April 19, 2024 @ 22:12 +03:00

GBPUSD Wave Analysis 19 April 2024
April 19, 2024 @ 22:11 +03:00

EURJPY Wave Analysis 18 April 2024
April 18, 2024 @ 23:09 +03:00

EURUSD Wave Analysis 18 April 2024
April 18, 2024 @ 23:08 +03:00