

Natural Gas Wave Analysis – 10 March, 2020
March 10, 2020 @ 17:42 +03:00

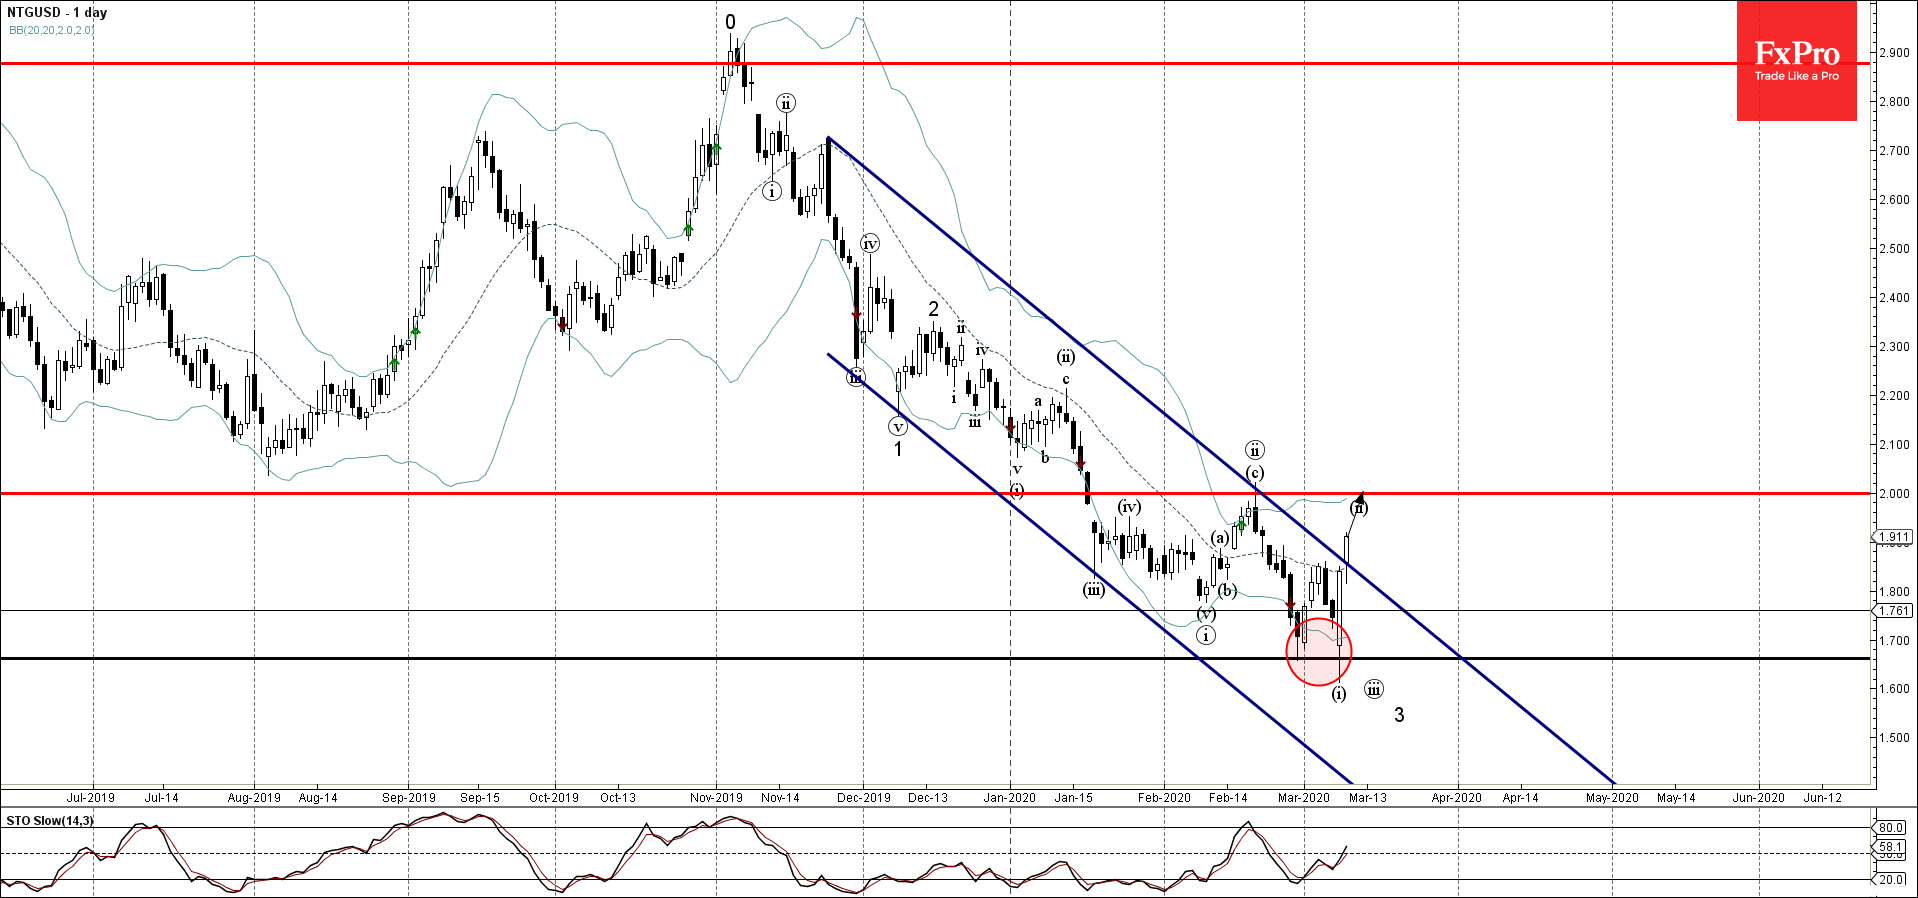
- Natural Gas reversed from support level 1.6610
- Likely to rise to 2.000
Natural Gas rising steadily following the earlier upward reversal from the support area lying between the support level 1.6610 (which formed the recent Bullish Engulfing at the end of February) and the the lower daily Bollinger Band.
The latest reversal from this support area created the daily Japanese candlesticks reversal pattern Morning Star – indicating the strength of the support area near 1.6610.
Given the clear bullish divergence on eth daily Stochastic – Natural Gas is likely to rise further toward the next resistance level 2.000 (top of the earlier correction (ii) and the target price for the completion of the active minor wave ii).

April 18, 2024 @ 23:09 +03:00

April 18, 2024 @ 23:08 +03:00

April 17, 2024 @ 22:40 +03:00

April 17, 2024 @ 22:38 +03:00