

Technical analysis
IBM Wave Analysis – 30 January, 2020
January 30, 2020 @ 16:48 +03:00
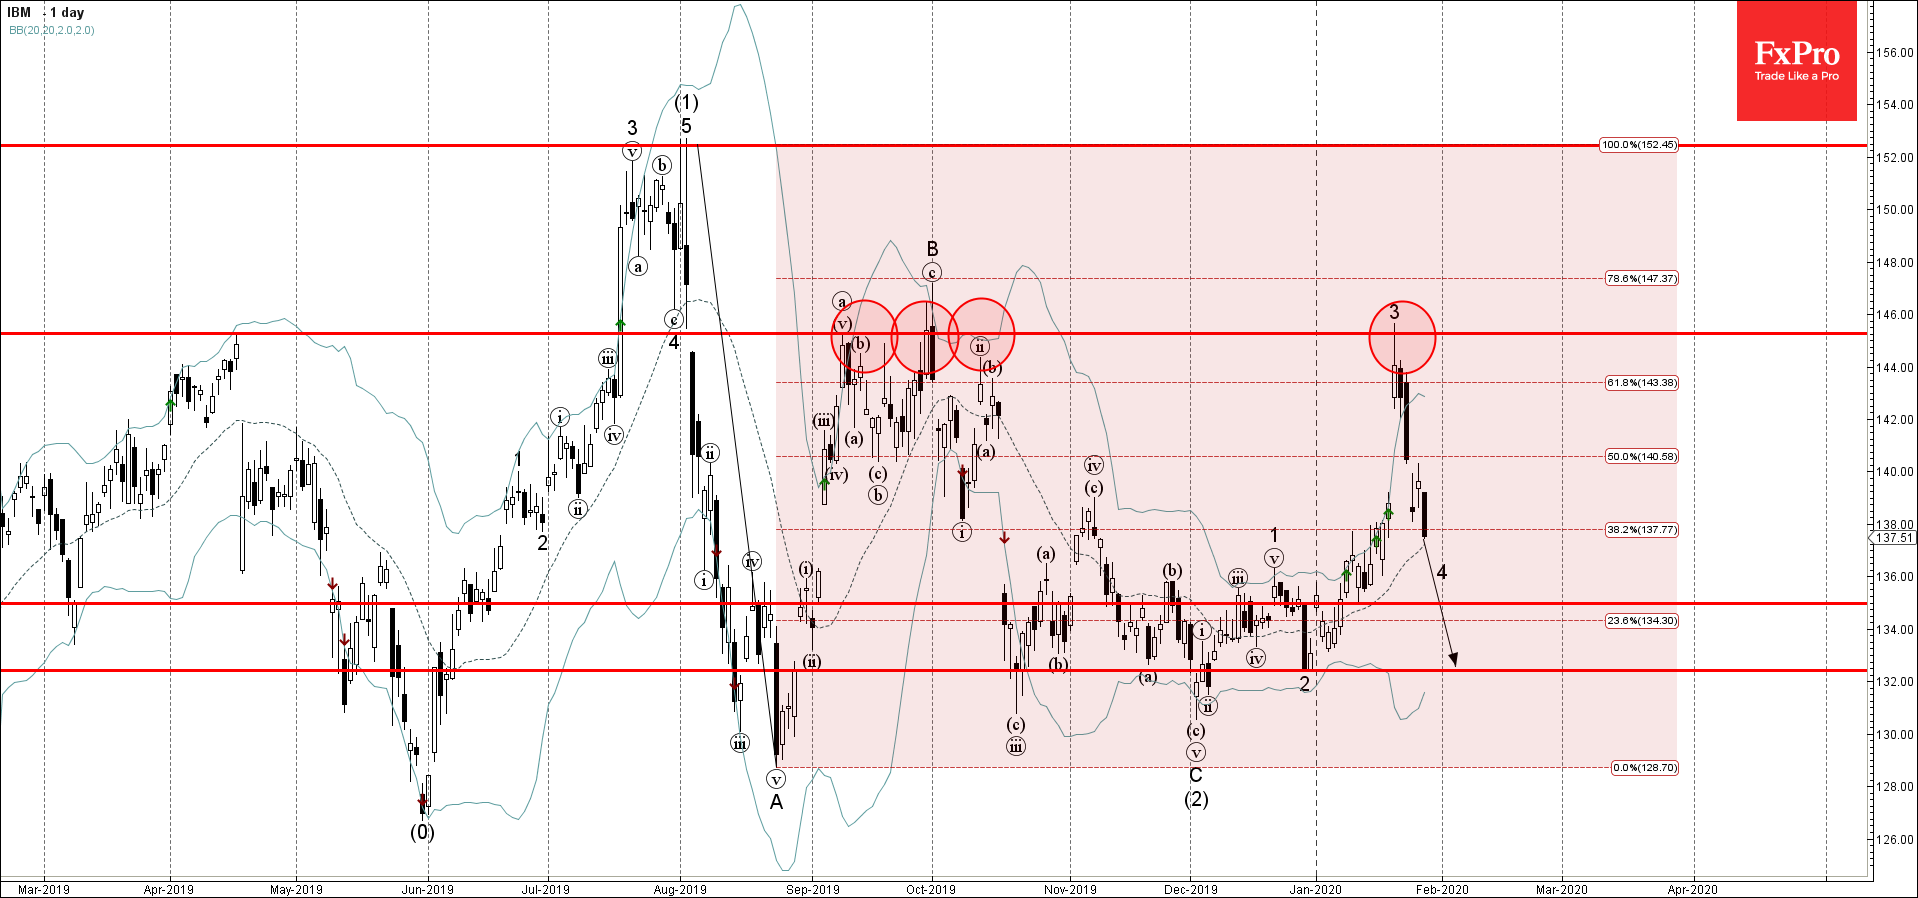
- IBM falling inside corrective wave 4
- Likely to fall to 135.00
IBM recently reversed down from the key resistance level 145.25 (which reversed the price in September) – strengthened by the upper daily Bollinger Band and by the 61.8% Fibonacci correction of the previous sharp downward correction A from the start of August.
The downward reversal from the resistance level 145.25 started the active short-term corrective wave 4.
IBM is likely to fall further toward the next support level 135.00 – the breakout of which can lead to further losses toward the next support level 132.40.
Related Articles

GBPCAD Wave Analysis 25 April 2024
April 25, 2024 @ 20:10 +03:00

GBPAUD Wave Analysis 25 April 2024
April 25, 2024 @ 20:09 +03:00

EURGBP Wave Analysis 24 April 2024
April 24, 2024 @ 21:42 +03:00

EURJPY Wave Analysis 24 April 2024
April 24, 2024 @ 21:40 +03:00