

Technical analysis
Google Wave Analysis – 23 September, 2019
September 23, 2019 @ 16:48 +03:00

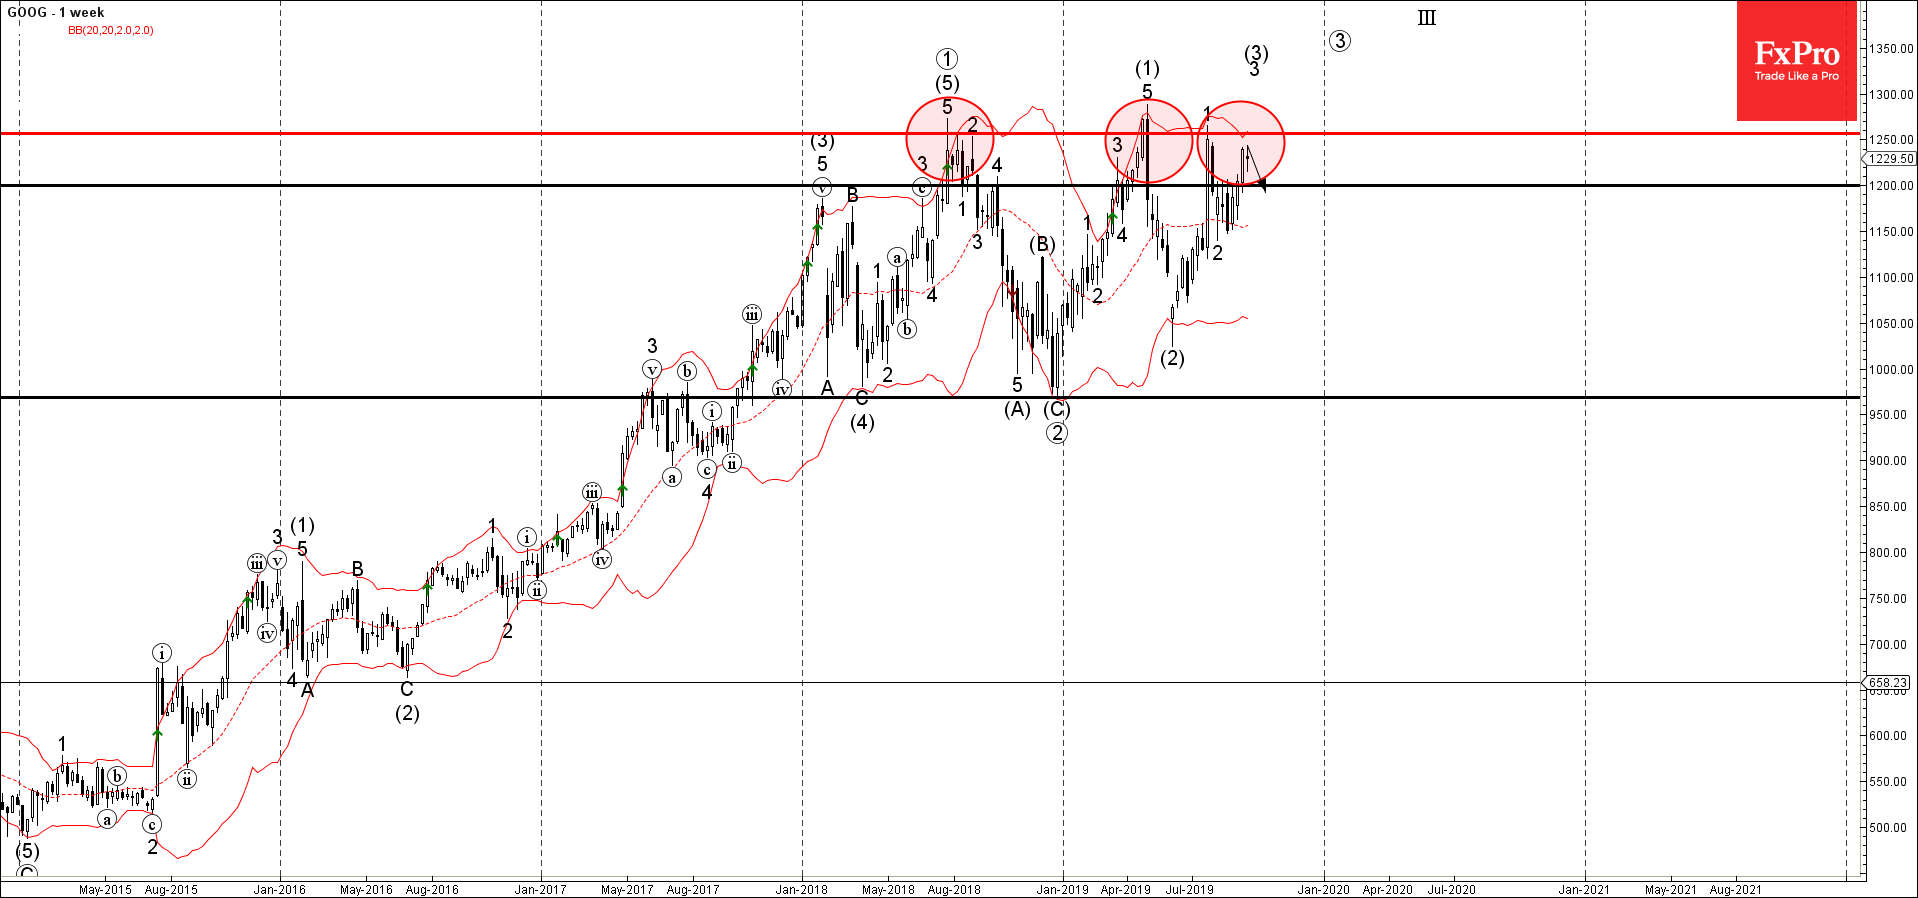
- Google reversed from resistance area
- Likely to fall to 1200.00
Google today reversed down from the resistance area lying between the strong resistance level 1250.00 (which has reversed the price multiple times from the middle of 2018, as can be seen from the weekly Google chart below) and the upper weekly Bollinger Band.
The downward reversal from this resistance area runs counter to the earlier impulse waves 3 and (3).
Google is likely to correct down to the next support level 1200.00 – after which the price might re-test the resistance level 1250.00 – which is likely to be followed by the sharp downward correction.
Related Articles

GBPCAD Wave Analysis 25 April 2024
April 25, 2024 @ 20:10 +03:00

GBPAUD Wave Analysis 25 April 2024
April 25, 2024 @ 20:09 +03:00

EURGBP Wave Analysis 24 April 2024
April 24, 2024 @ 21:42 +03:00

EURJPY Wave Analysis 24 April 2024
April 24, 2024 @ 21:40 +03:00