

Technical analysis
Goldman Sachs Wave Analysis – 30 December, 2019
December 30, 2019 @ 15:16 +03:00
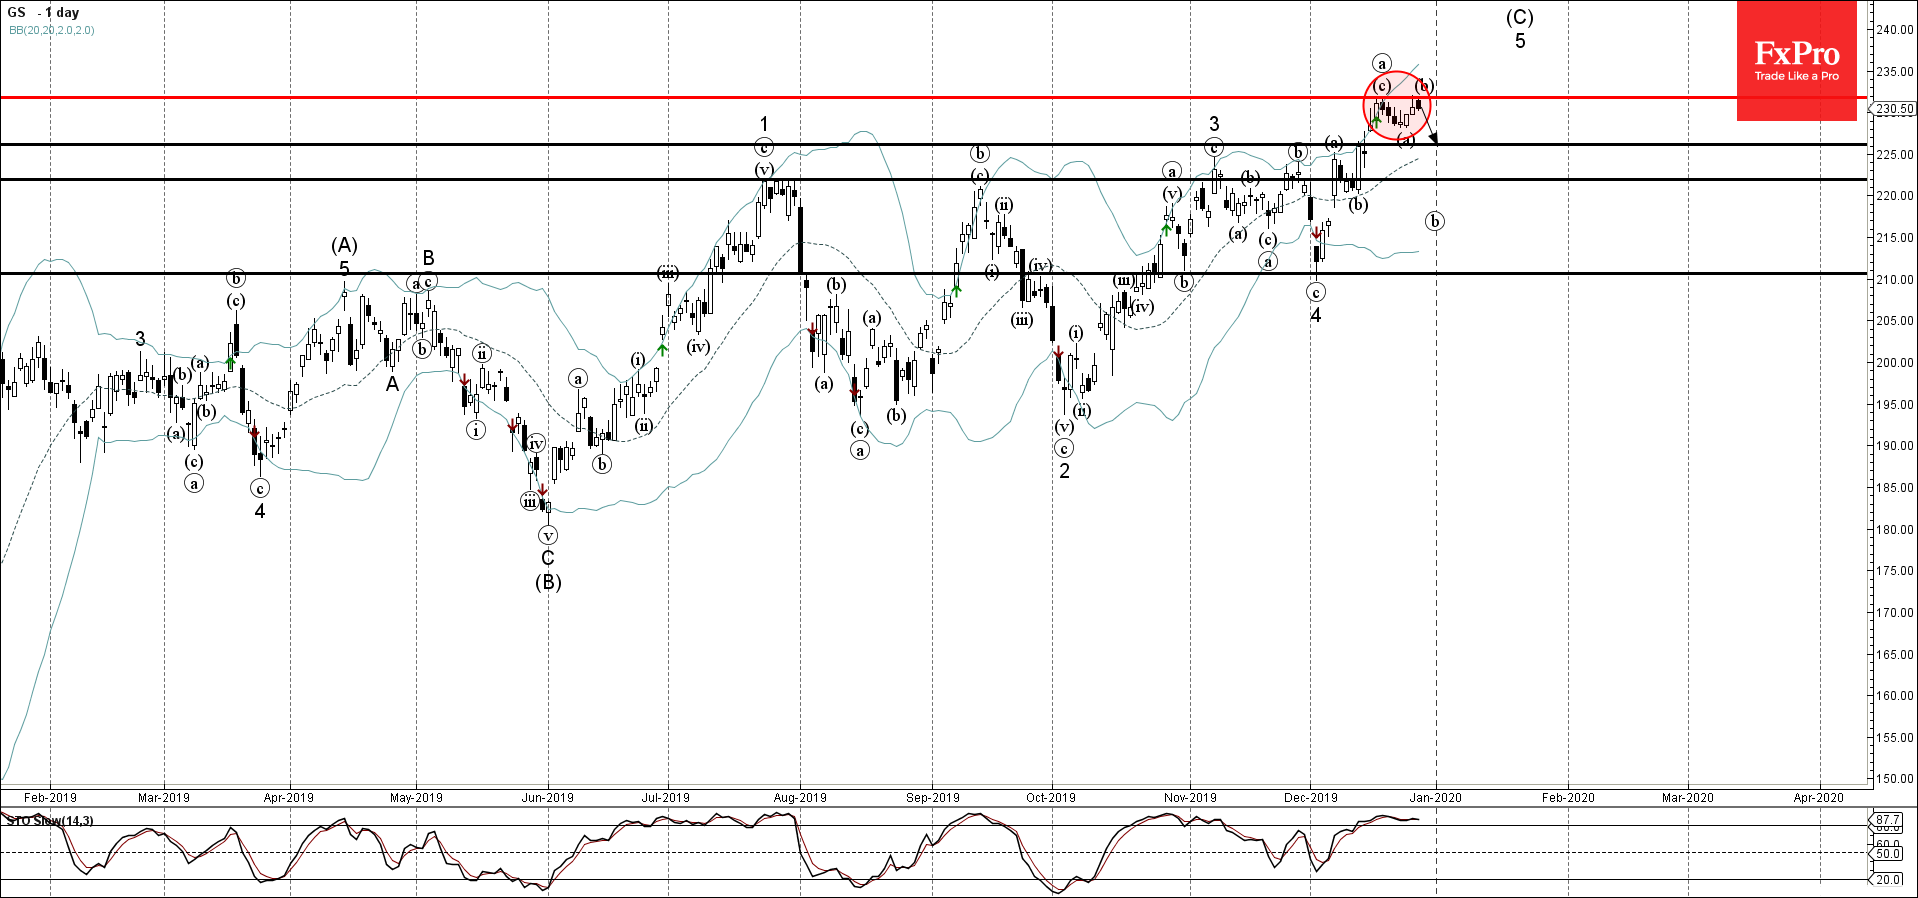
- Goldman Sachs reversed from resistance area
- Likely to fall to 225.00
Goldman Sachs recently reversed down from the resistance zone lying between the resistance level 231.00 (top of the previous impulse wave (c)) and the upper daily Bollinger Band.
The downward reversal from this resistance area started the active short-term impulse wave (c) of the ABC correction (b).
Given the overbought daily Stochastic – Goldman Sachs is expected to fall further toward the next support level 225.00 (former monthly high from November).
Related Articles

Intel Wave Analysis 19 April 2024
April 19, 2024 @ 22:12 +03:00

GBPUSD Wave Analysis 19 April 2024
April 19, 2024 @ 22:11 +03:00

EURJPY Wave Analysis 18 April 2024
April 18, 2024 @ 23:09 +03:00

EURUSD Wave Analysis 18 April 2024
April 18, 2024 @ 23:08 +03:00