

Goldman Sachs Wave Analysis 27 October, 2020
October 27, 2020 @ 18:21 +03:00
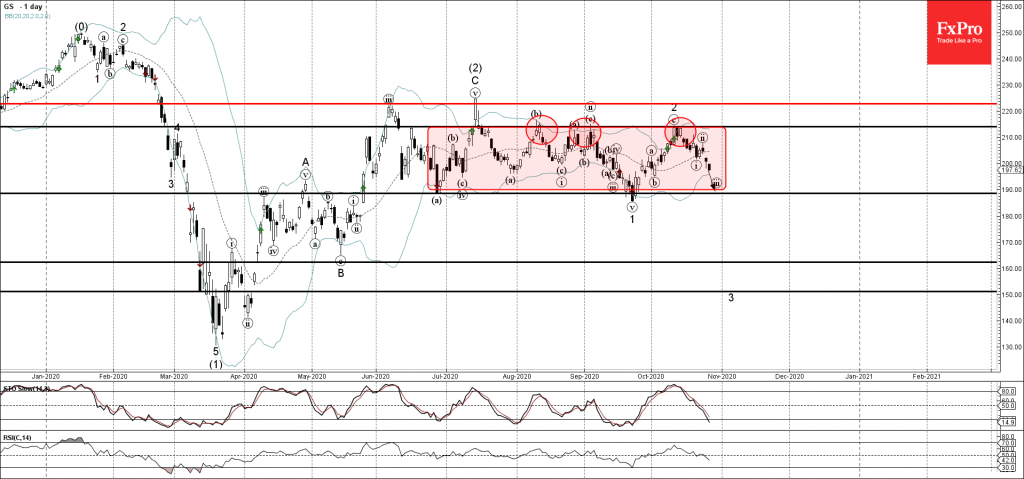
• Goldman Sachs falling inside sideways price range
• Likely to reach to 190.00
Goldman Sachs recently reversed down from the resistance level 214.00 (which is the upper boundary of the sideways price range from August) strengthened by the upper daily Bollinger Band.
The downward reversal from the resistance level 214.00 started the active short-term downward impulse wave 3 – which belongs to the longer-term downward impulse (3) from July.
Goldman Sachs is likely to fall further toward the next support level 190.00 (lower border of this price range and the target price for the completion of the active impulse wave (iii)).

April 25, 2024 @ 20:10 +03:00

April 25, 2024 @ 20:09 +03:00

April 24, 2024 @ 21:42 +03:00

April 24, 2024 @ 21:40 +03:00