

Technical analysis
Gold Wave Analysis – 27 April, 2020
April 27, 2020 @ 17:25 +03:00

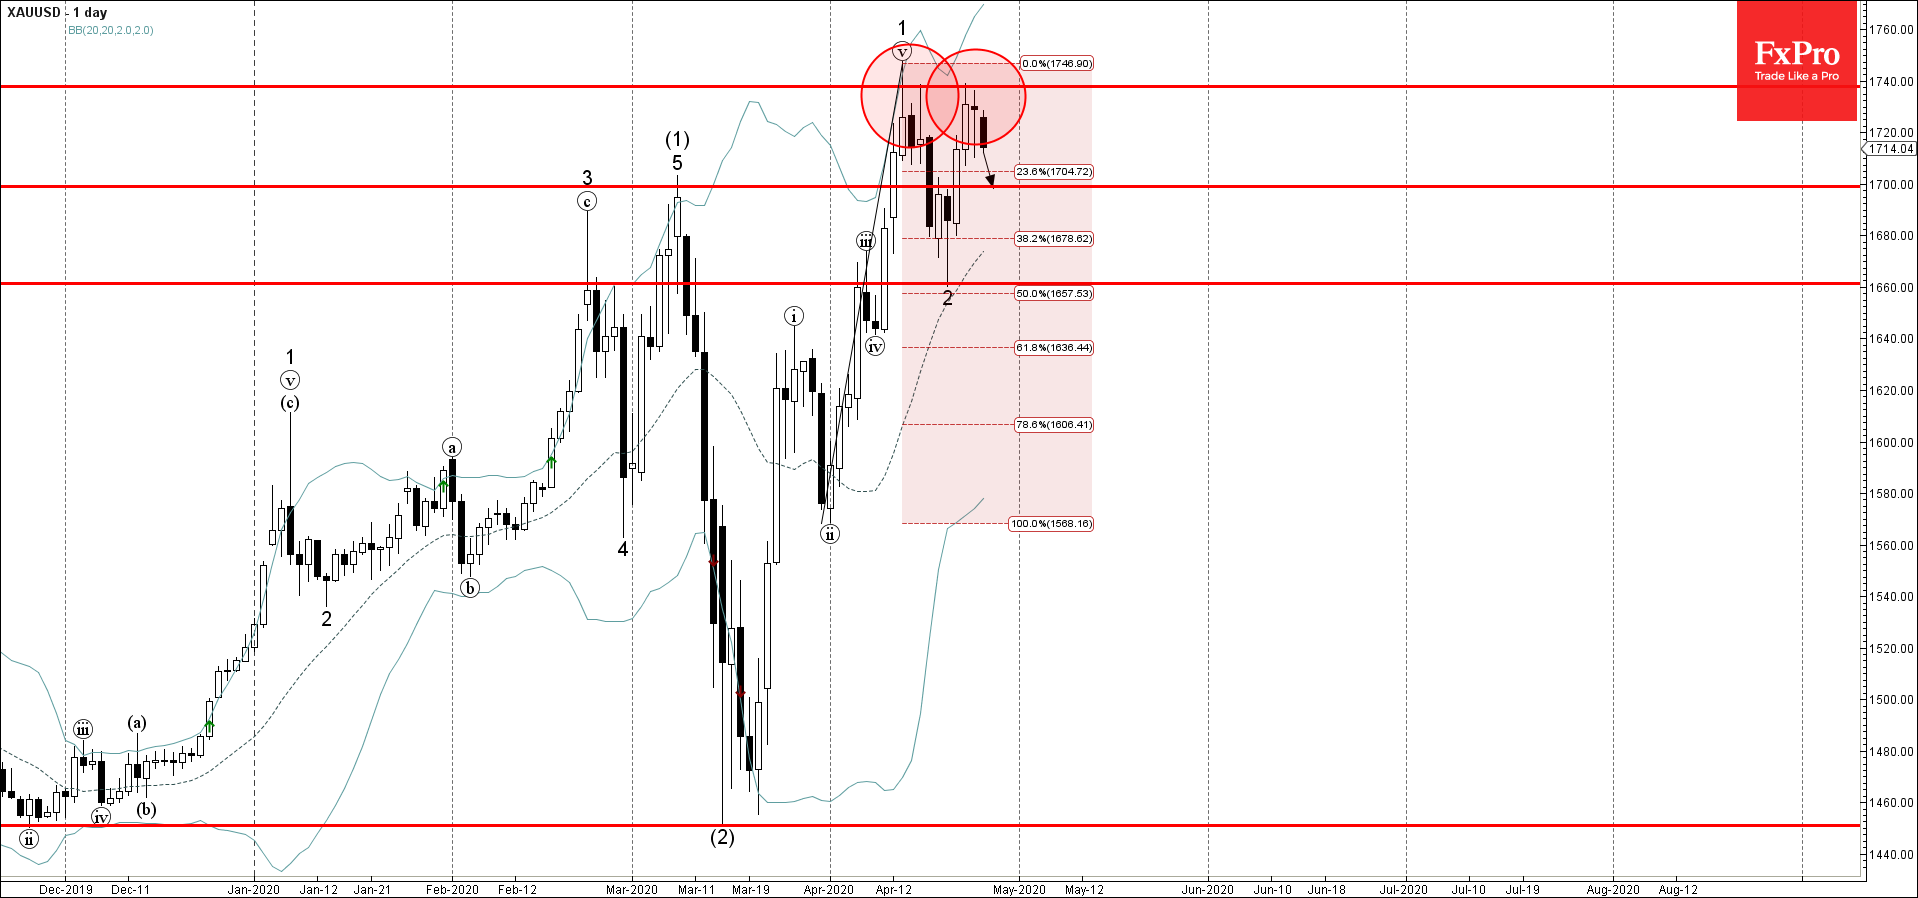
- Gold reversed from key resistance level 1740.00
- Likely to fall to 1700.00
Gold recently reversed down from the key resistance level 1740.00 (which has been reversing the price from the start of April).
The resistance zone near the resistance level 1740.00 was strengthened by the upper daily Bollinger Band.
Gold is expected to fall further toward the next round support level 1700.00 – the breakout of which can lead to further losses toward 1660.00 (low of the previous wave 2).
Related Articles

EURJPY Wave Analysis 18 April 2024
April 18, 2024 @ 23:09 +03:00

EURUSD Wave Analysis 18 April 2024
April 18, 2024 @ 23:08 +03:00

WTI Wave Analysis 17 April 2024
April 17, 2024 @ 22:40 +03:00

EURGBP Wave Analysis 17 April 2024
April 17, 2024 @ 22:38 +03:00