

Technical analysis
Gold Wave Analysis – 23 March, 2020
March 23, 2020 @ 17:29 +03:00

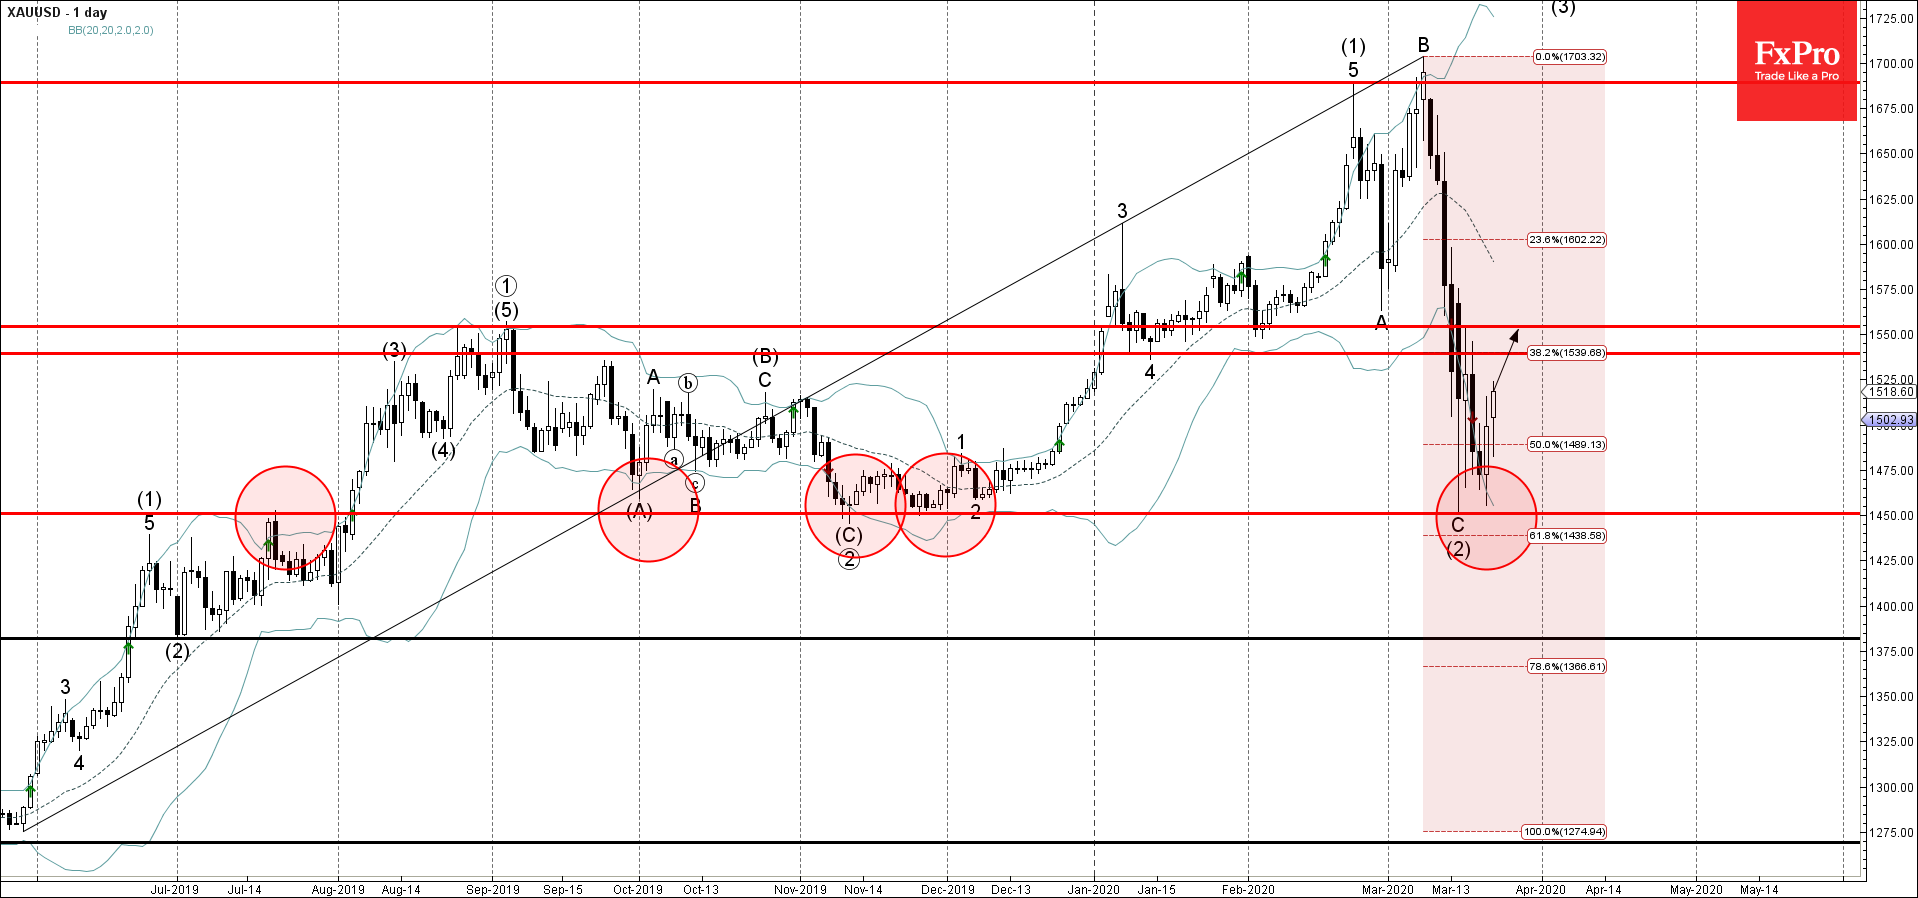
- Gold reversed from support area
- Likely to rise to 1550.00
Gold recently reversed up from the support area lying between the key support level 1450.00 (which has been reversing the price from September), lower daily Bollinger Band and the 61.8% Fibonacci correction of the previous weekly impulse from 2019.
The upward reversal from this support area created the daily Japanese candlesticks reversal pattern Bullish Engulfing.
Gold is expected to rise further toward the next resistance level 1550.00 (former monthly low from February).
Related Articles

Ebay Wave Analysis 30 April 2024
April 30, 2024 @ 20:27 +03:00

GBPAUD Wave Analysis 30 April 2024
April 30, 2024 @ 20:26 +03:00

ANF Wave Analysis 29 April 2024
April 29, 2024 @ 22:32 +03:00

GBPUSD Wave Analysis 29 April 2024
April 29, 2024 @ 22:29 +03:00