

Technical analysis
Gold Wave Analysis – 20 February, 2020
February 20, 2020 @ 18:07 +03:00

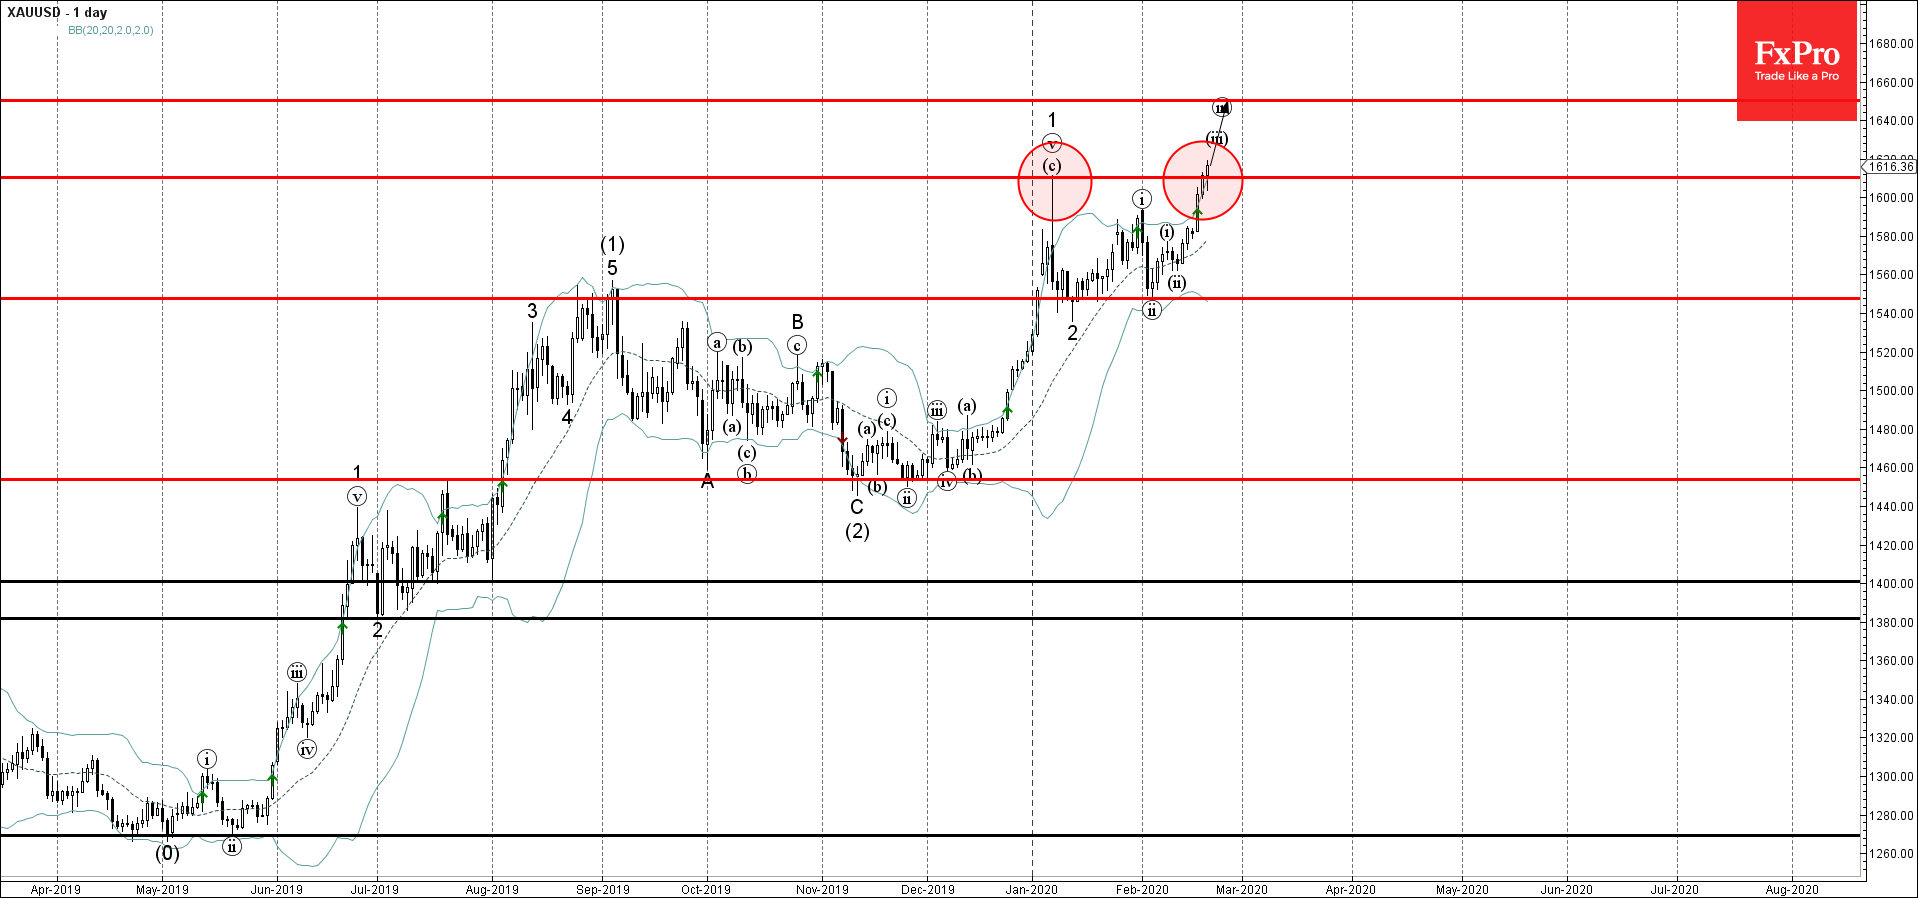
- Gold broke pivotal resistance level 1610.00
- Likely to rise to 1650.00
Gold recently broke sharply above the pivotal resistance level 1610.00 (which stopped the previous sharp impulse wave 1 at the start of January, as can be seen from the daily Gold chart below).
The breakout of the resistance level 1610.00 continues the active impulse wave (iii) of the medium-term upward impulse sequence (3) from the start of November.
Considering the strong daily uptrend Gold is likely to rise further toward the next resistance level 1650.00 (calculated price for the termination of the active impulse wave (iii)).
Related Articles

Intel Wave Analysis 19 April 2024
April 19, 2024 @ 22:12 +03:00

GBPUSD Wave Analysis 19 April 2024
April 19, 2024 @ 22:11 +03:00

EURJPY Wave Analysis 18 April 2024
April 18, 2024 @ 23:09 +03:00

EURUSD Wave Analysis 18 April 2024
April 18, 2024 @ 23:08 +03:00