

Technical analysis
Gold Wave Analysis – 09 April, 2019
April 09, 2019 @ 17:00 +03:00

- Gold reversed from support area
- Further gains are likely
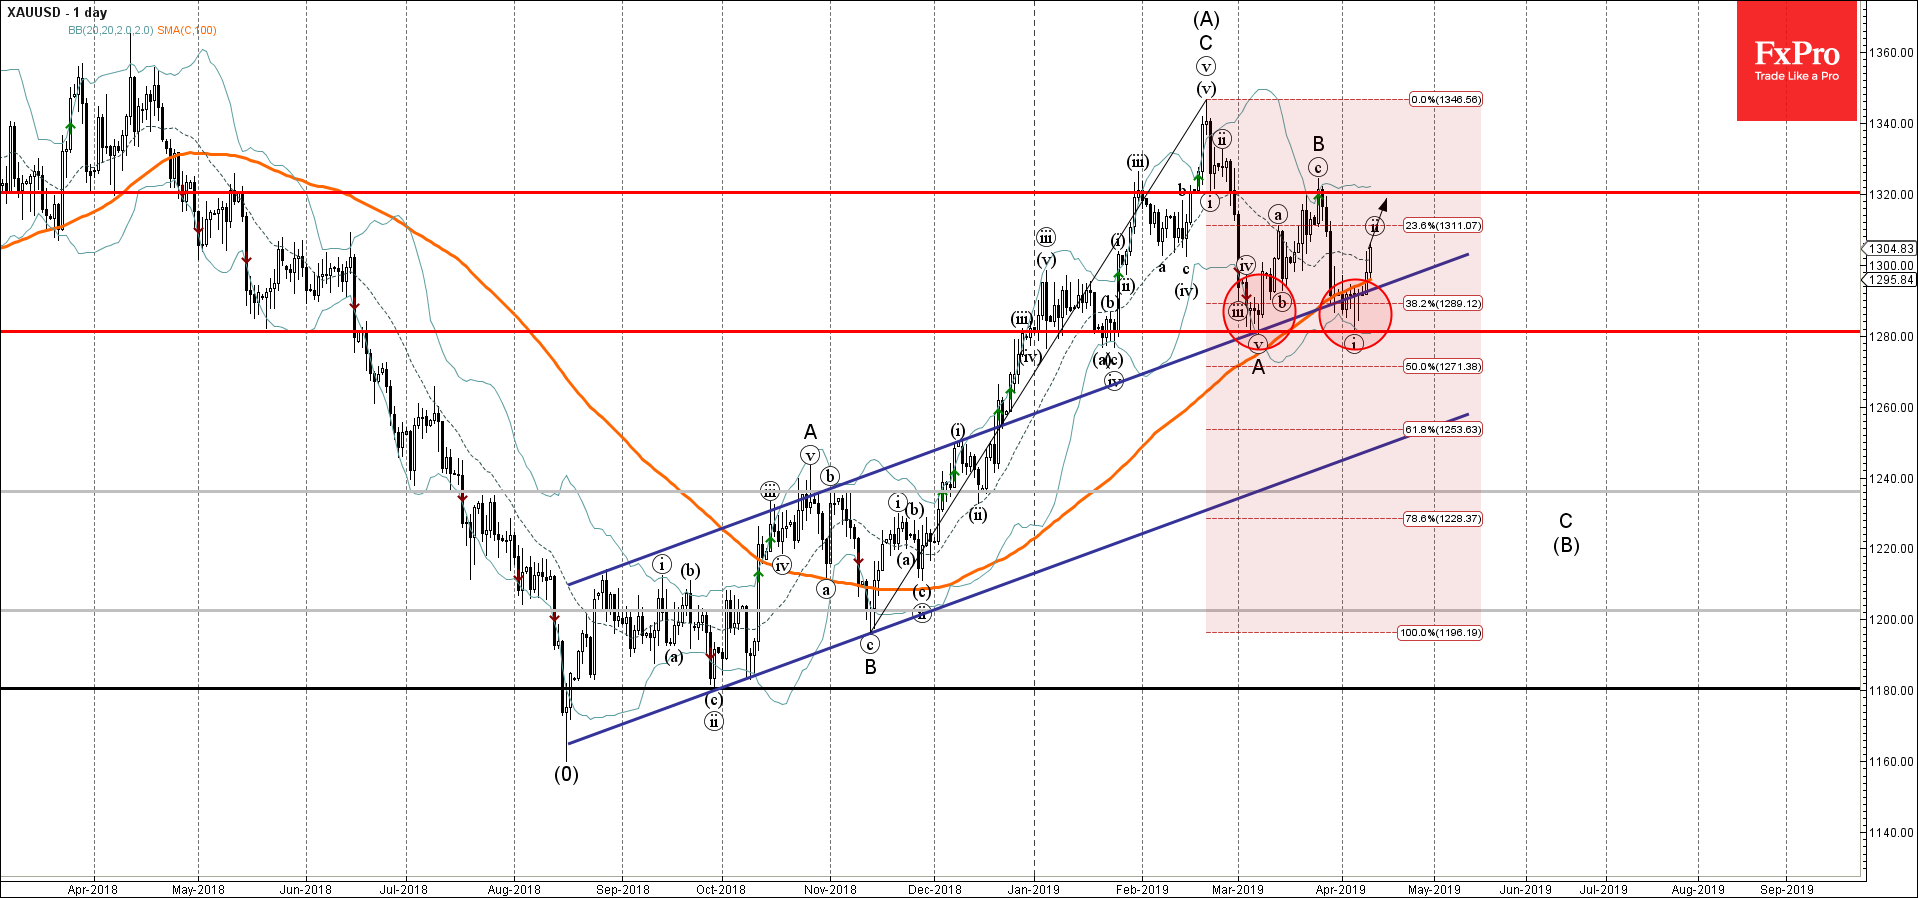
Gold recently reversed up from the support area lying between the key support level 1280.00 (monthly low from March), lower daily Bollinger Band and the 38.2% Fibonacci correction of the previous upward impulse from November.
This support area was further strengthened by the 100-dat moving average and by the upper trendline of the recently broken daily up channel from August of 2018.
Gold is expected to rise further and re-test the next resistance level 1320.00 (monthly high from March).
Related Articles

GBPCAD Wave Analysis 25 April 2024
April 25, 2024 @ 20:10 +03:00

GBPAUD Wave Analysis 25 April 2024
April 25, 2024 @ 20:09 +03:00

EURGBP Wave Analysis 24 April 2024
April 24, 2024 @ 21:42 +03:00

EURJPY Wave Analysis 24 April 2024
April 24, 2024 @ 21:40 +03:00