

Technical analysis
GBPUSD Wave Analysis – 6 May, 2020
May 06, 2020 @ 16:48 +03:00

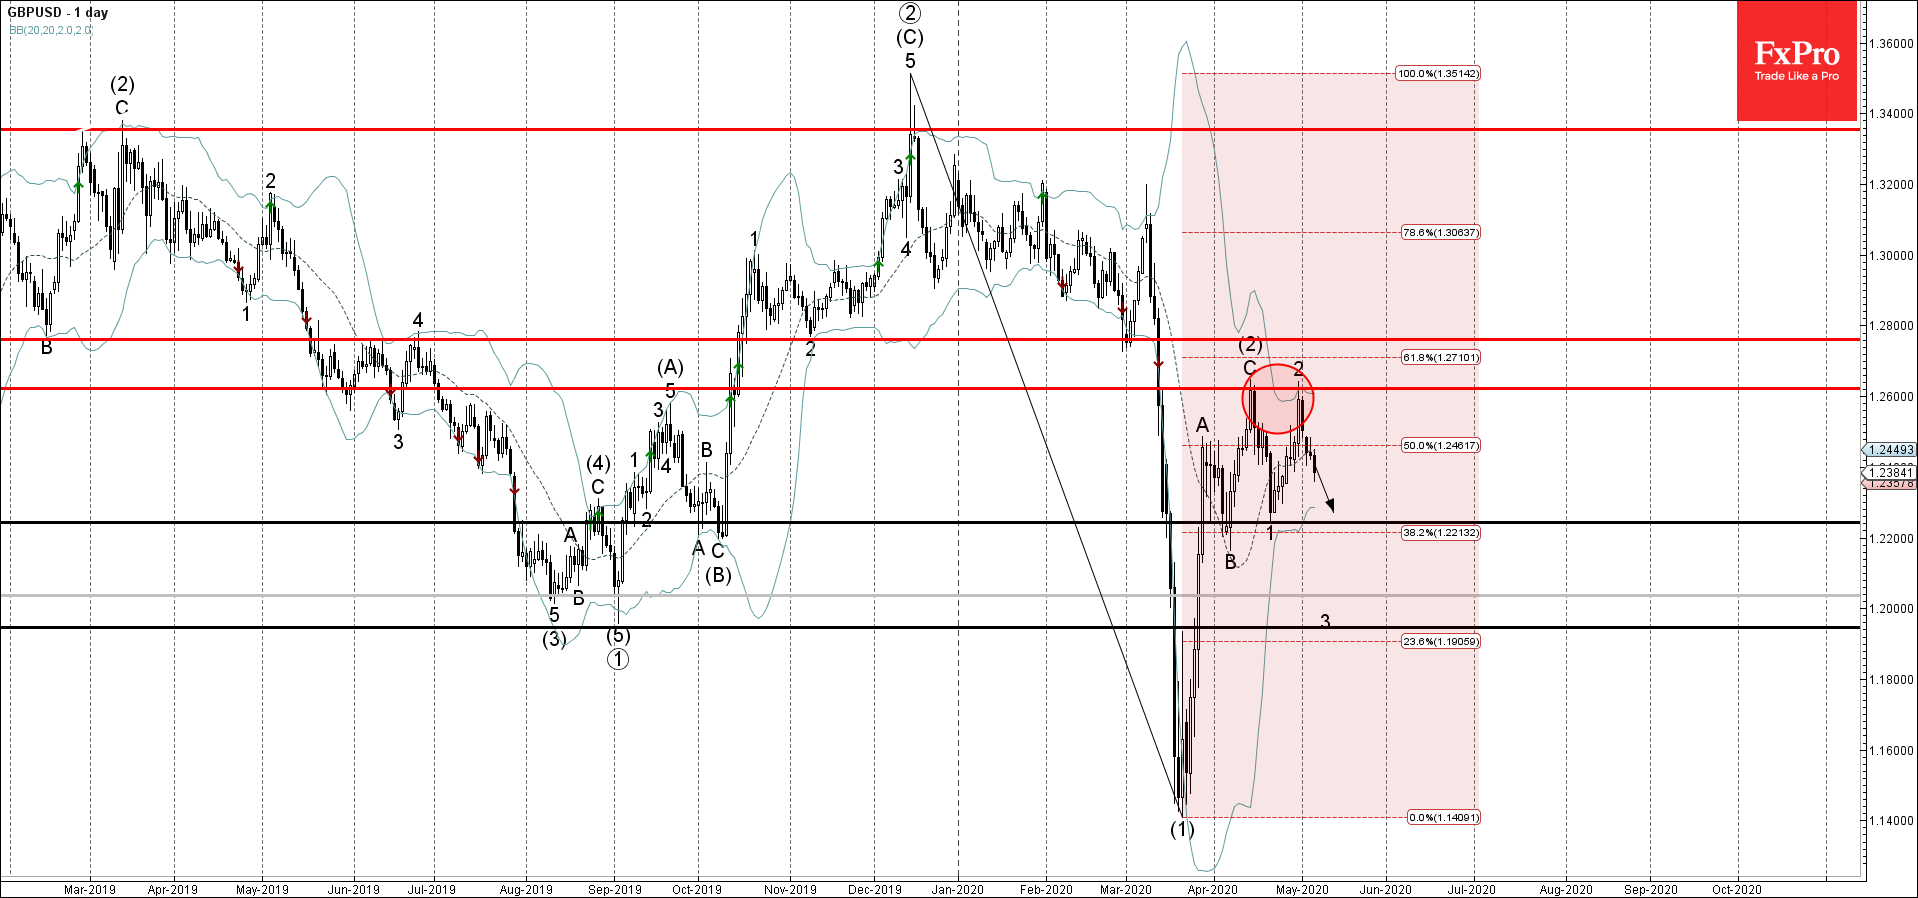
- GBPUSD reversed from resistance area
- Likely to fall to 1.2240
GBPUSD recently reversed down from the resistance area lying between the resistance level 1.2610 (top of the previous correction (2)), upper daily Bollinger Band and the 61.8% Fibonacci correction of the previous down ward impulse (1) from December.
The downward reversal from this resistance area created the daily Japanese candlesticks reversal pattern Bearish Engulfing.
GBPUSD is expected to fall further toward the next support level 1.2240 (low of the previous impulse wave 1).
Related Articles

EURJPY Wave Analysis 18 April 2024
April 18, 2024 @ 23:09 +03:00

EURUSD Wave Analysis 18 April 2024
April 18, 2024 @ 23:08 +03:00

WTI Wave Analysis 17 April 2024
April 17, 2024 @ 22:40 +03:00

EURGBP Wave Analysis 17 April 2024
April 17, 2024 @ 22:38 +03:00