

Technical analysis
GBPUSD Wave Analysis – 20 March, 2019
March 20, 2019 @ 18:42 +03:00

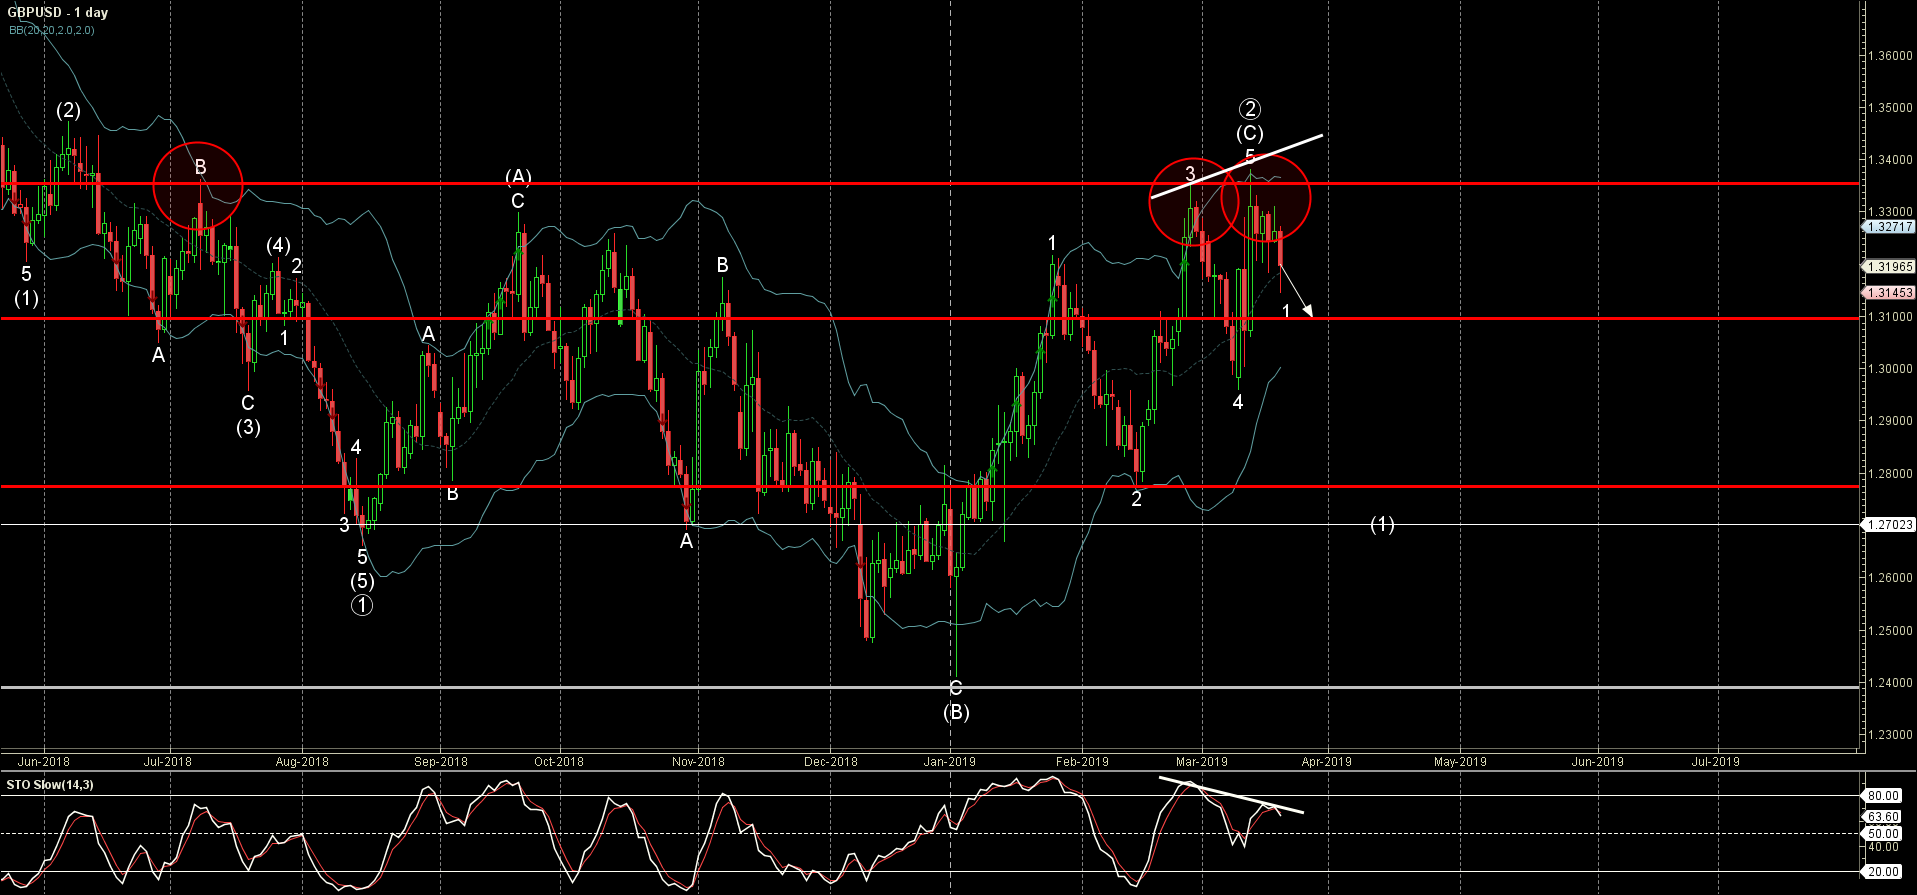
- GBPUSD reversed from resistance area
- Further losses are likely
GBPUSD recently reversed down from the resistance area lying between the multi-month resistance level 1.3350 (which has been reversing the price from July) and the upper daily Bollinger Band.
The downward reversal from this resistance area started the active short-term impulse wave 1.
Given the clear bearish divergence on the daily Stochastic indicator – GBPUSD is expected to fall further and re-test the next support level 1.3100.
Related Articles

Intel Wave Analysis 19 April 2024
April 19, 2024 @ 22:12 +03:00

GBPUSD Wave Analysis 19 April 2024
April 19, 2024 @ 22:11 +03:00

EURJPY Wave Analysis 18 April 2024
April 18, 2024 @ 23:09 +03:00

EURUSD Wave Analysis 18 April 2024
April 18, 2024 @ 23:08 +03:00