

Technical analysis
GBPUSD Wave Analysis – 14 April, 2020
April 14, 2020 @ 17:06 +03:00

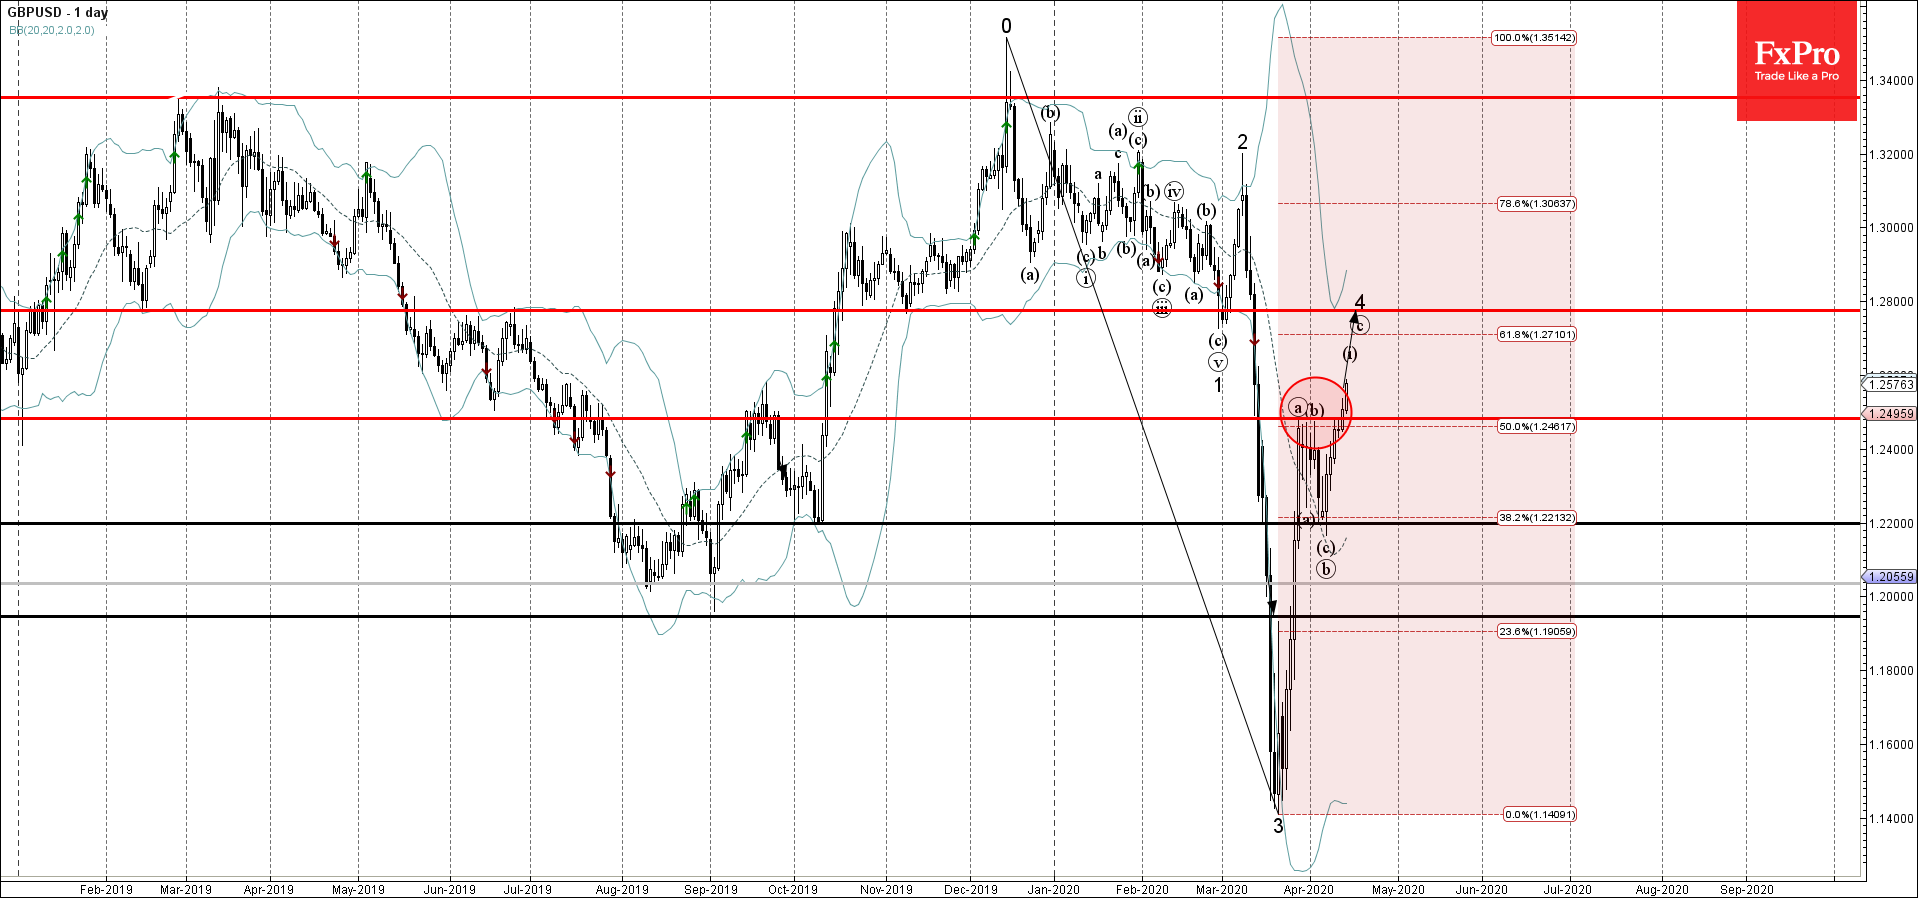
- GBPUSD broke resistance area
- Likely to rise to 1.2800
GBPUSD recently broke the resistance area lying between the resistance level 1.250 (top of the previous correction (a)) and the 50% Fibonacci retracement of the previous downward impulse 3 from the middle of December.
The breakout of this resistance area accelerated the active short-term impulse wave (c) – which belongs to the ABC correction 4 from March.
GBPUSD is likely to rise further toward the next resistance level 1.2800 (former strong support from the end of February and the likely price for the completion of the active wave 4).
Related Articles

EURGBP Wave Analysis 24 April 2024
April 24, 2024 @ 21:42 +03:00

EURJPY Wave Analysis 24 April 2024
April 24, 2024 @ 21:40 +03:00

WTI crude oil Wave Analysis 23 April 2024
April 23, 2024 @ 22:47 +03:00

USDCAD Wave Analysis 23 April 2024
April 23, 2024 @ 22:46 +03:00