

Technical analysis
GBPUSD Wave Analysis – 10 December , 2018
December 10, 2018 @ 18:00 +03:00

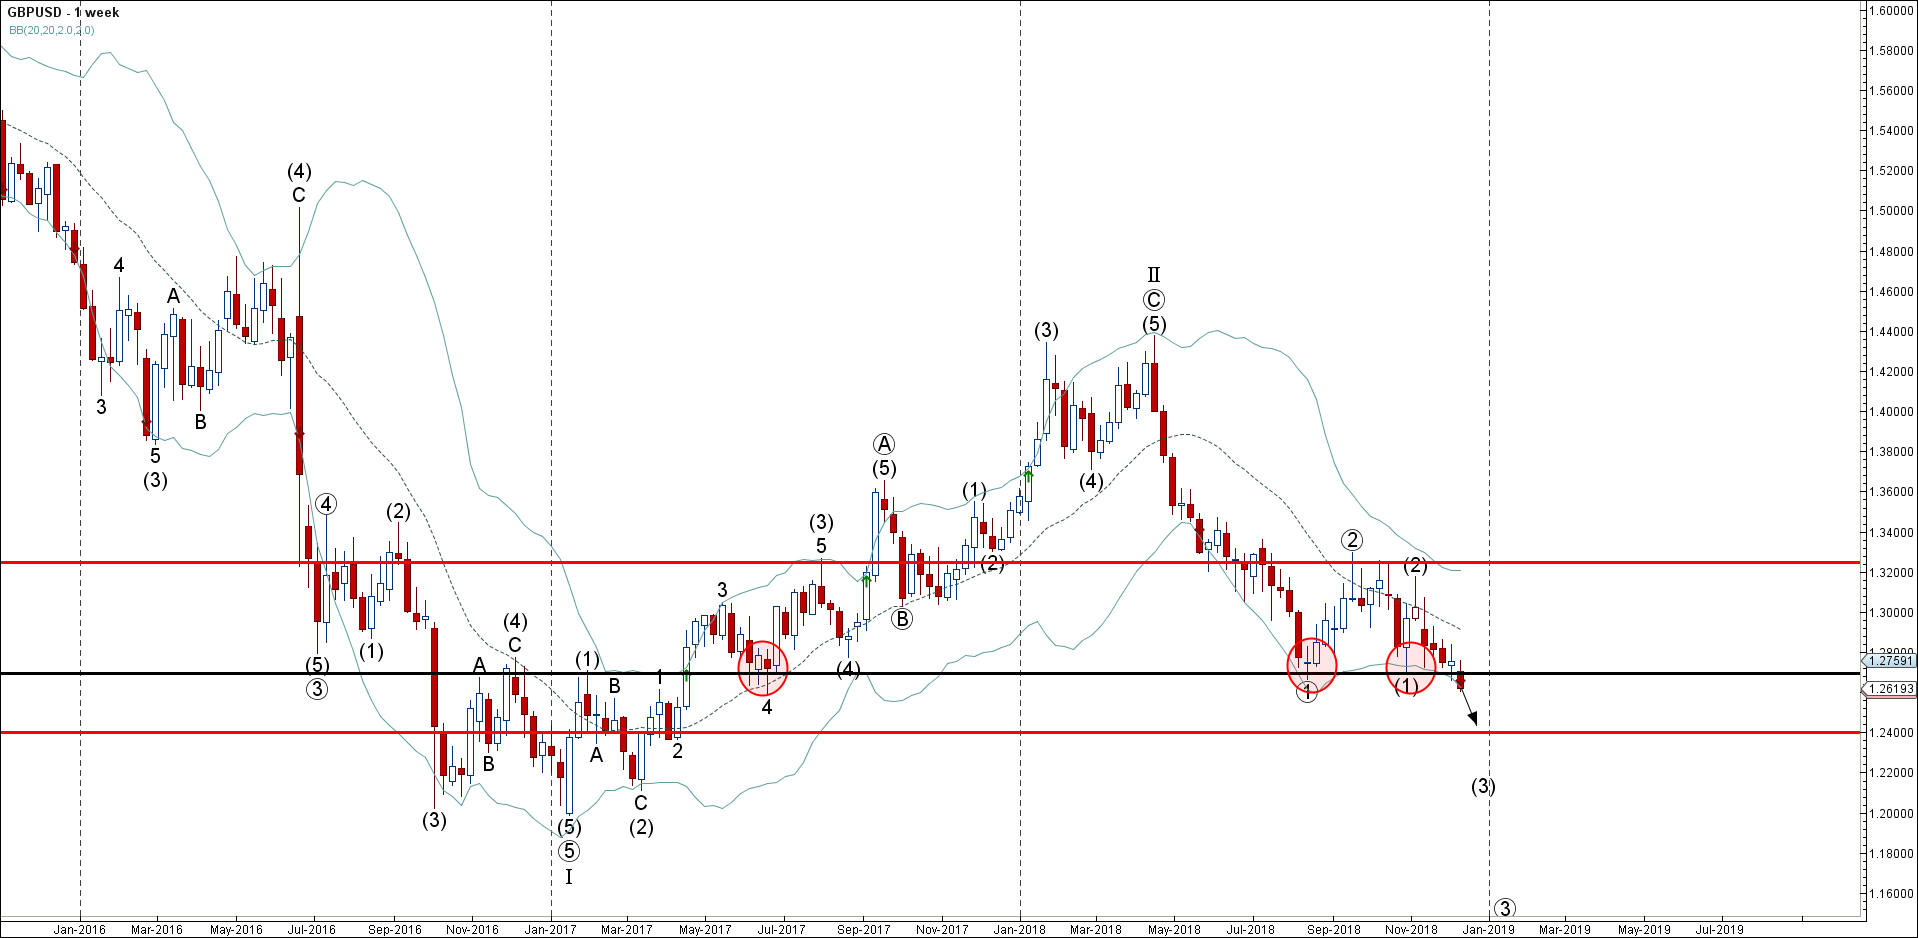
- GBPUSD broke multi-month support level 1.2700
- Further losses are likely
GBPUSD today broke through the strong, multi-month support level 1.2700 (which has been steadily reversing the price from the middle of 2017 – as can be seen from the weekly GBPUSD chart below).
The breakout of the support level 1.2690 continues the active medium-term impulse wave (3) of the long-term downer impulse sequence from September.
GBPUSD is expected to fall further and re-test the next resistance level 1.2400 (former support from April of 2017). Strong resistance now stands at 1.2700.
Related Articles

WTI crude oil Wave Analysis 23 April 2024
April 23, 2024 @ 22:47 +03:00

USDCAD Wave Analysis 23 April 2024
April 23, 2024 @ 22:46 +03:00

Intel Wave Analysis 19 April 2024
April 19, 2024 @ 22:12 +03:00

GBPUSD Wave Analysis 19 April 2024
April 19, 2024 @ 22:11 +03:00