

GBPUSD and USDCHF Analysis
June 05, 2018 @ 15:02 +03:00

GBPUSD The GBPUSD pair has dropped into support at 1.32000 and rallied out last week to touch the high at 1.33982 close to the 1.34000 level. This sets up a 200 pip trading range for the moment. The topping pattern that formed in February to April has a target of approx. 1.30600 so there is scope for a further leg lower. Below that is the 1.30000 level where buyers will take opportunities to turn the market around. Selling can accelerate on a break below 1.32600.
From a resistance perspective a move above confirmed resistance at 1.34000 can still find difficulty up to 1.35200. The 200 DMA is located at 1.35690 and marks out the base of a resistive zone containing the 100 and 50 DMA’s and the trend line that extends up to 1.36850. The 1.37117 level is of interest to traders as a move past can see a rapid drive to 1.39217. For long positions 1.40000 remains a psychological upside target that puts them back on the front foot.
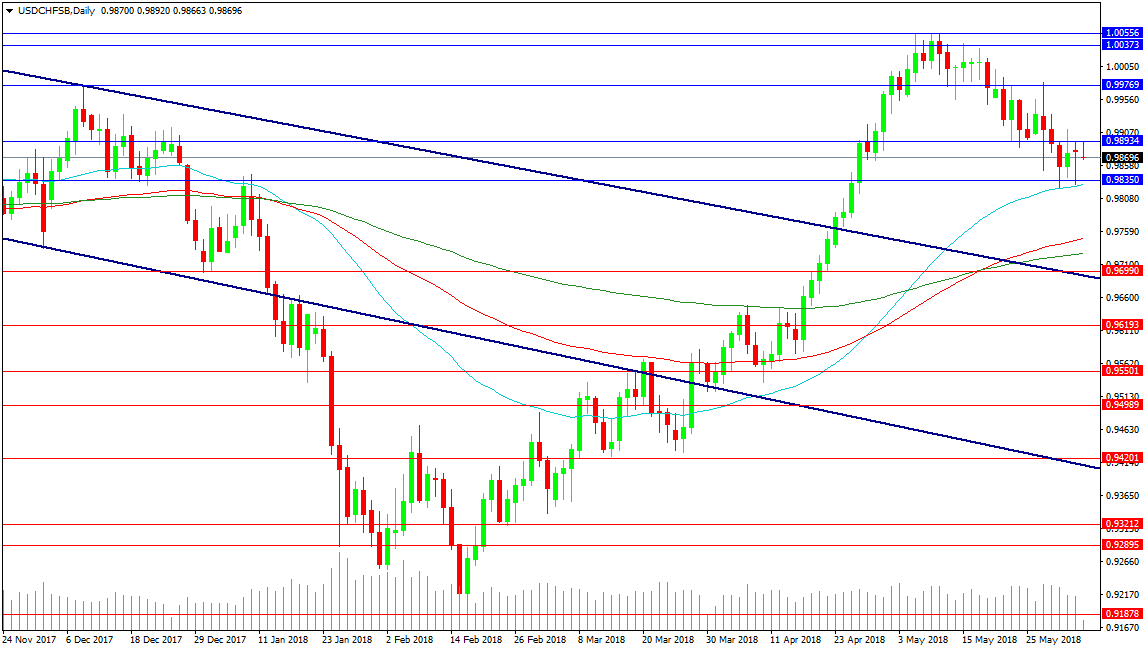
USDCHF This pair is seeing some excellent trading as it pulled back from the triple top at 1.00556. The price has found support at the 50 DMA at 0.98254 and resistance at 0.98934. These then form the staring lines for the next leg. A break higher would need to close above 0.99000 and then advance to resistance at 0.99769 before parity is again tested. The creation of higher lows on the move up reinforces the advance and points to a higher probability that the 1.00000 level is breached. Whether sellers have the stomach to short again at 1.00556 remains to be seen.
A move under the 50 DMA would likely find buyers at the 100 DMA at 0.97480, the 200 DMA at 0.97262 or the falling trend line at 0.96910 with a chance that the 0.96990 levels comes into play. Below this area price has consolidated around the 0.96000 level and 0.95000. The 0.94200 level has been used as support and resistance in recent months and will remain of interest to traders going forward.

April 25, 2024 @ 20:10 +03:00

April 25, 2024 @ 20:09 +03:00

April 24, 2024 @ 21:42 +03:00

April 24, 2024 @ 21:40 +03:00