

Technical analysis
GBPCHF Wave Analysis – 22 February, 2019
February 22, 2019 @ 18:34 +03:00

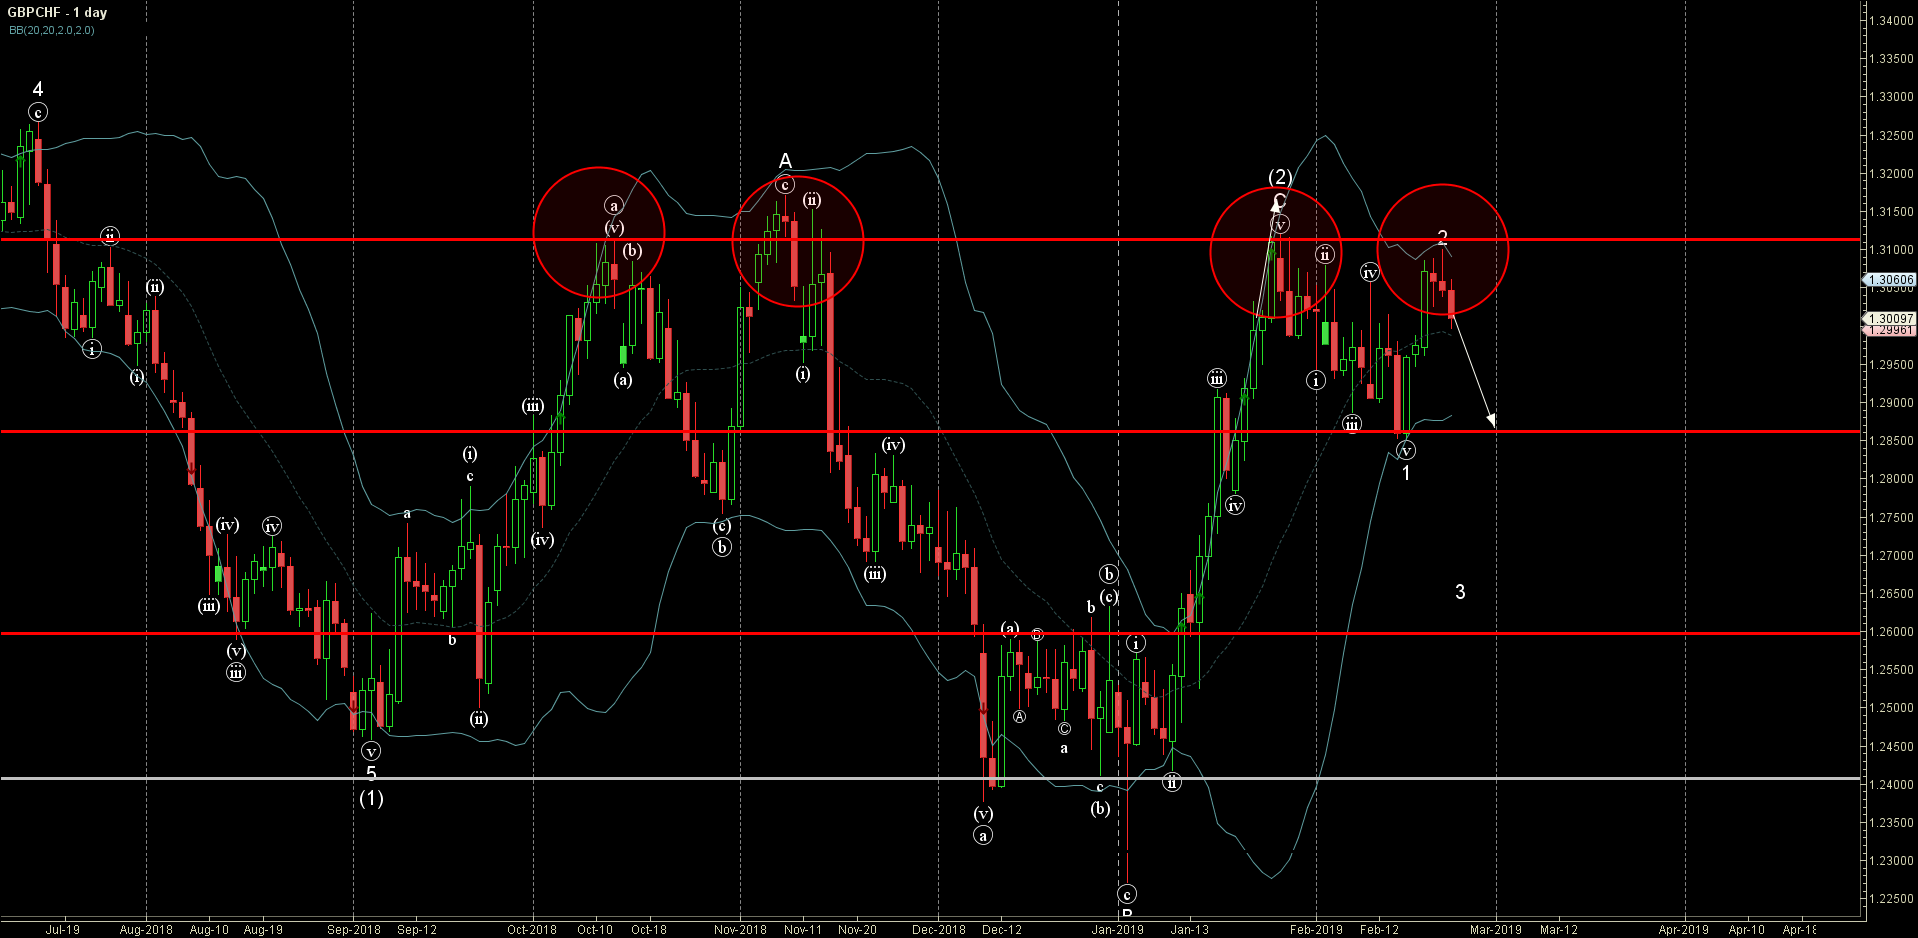
- GBPCHF reversed from resistance area
- Further losses are likely
GBPCHF recently reversed down from the resistance area lying between the multi-month resistance level 1.3110 (which has been reversing the price from the start of October, as can be seen below) and the upper daily Bollinger Band.
The downward reversal from this resistance area started the active short-term impulse wave 3 of the medium-term impulse sequence (3) from January.
GBPCHF is expected to fall further and re-test the next key support level 1.2860 (low of the previous impulse wave 1).
 GBPCHF
Related Articles

WTI crude oil Wave Analysis 23 April 2024
April 23, 2024 @ 22:47 +03:00

USDCAD Wave Analysis 23 April 2024
April 23, 2024 @ 22:46 +03:00

Intel Wave Analysis 19 April 2024
April 19, 2024 @ 22:12 +03:00

GBPUSD Wave Analysis 19 April 2024
April 19, 2024 @ 22:11 +03:00