

Technical analysis
GBPCHF Wave Analysis – 17 January, 2019
January 17, 2019 @ 15:31 +03:00

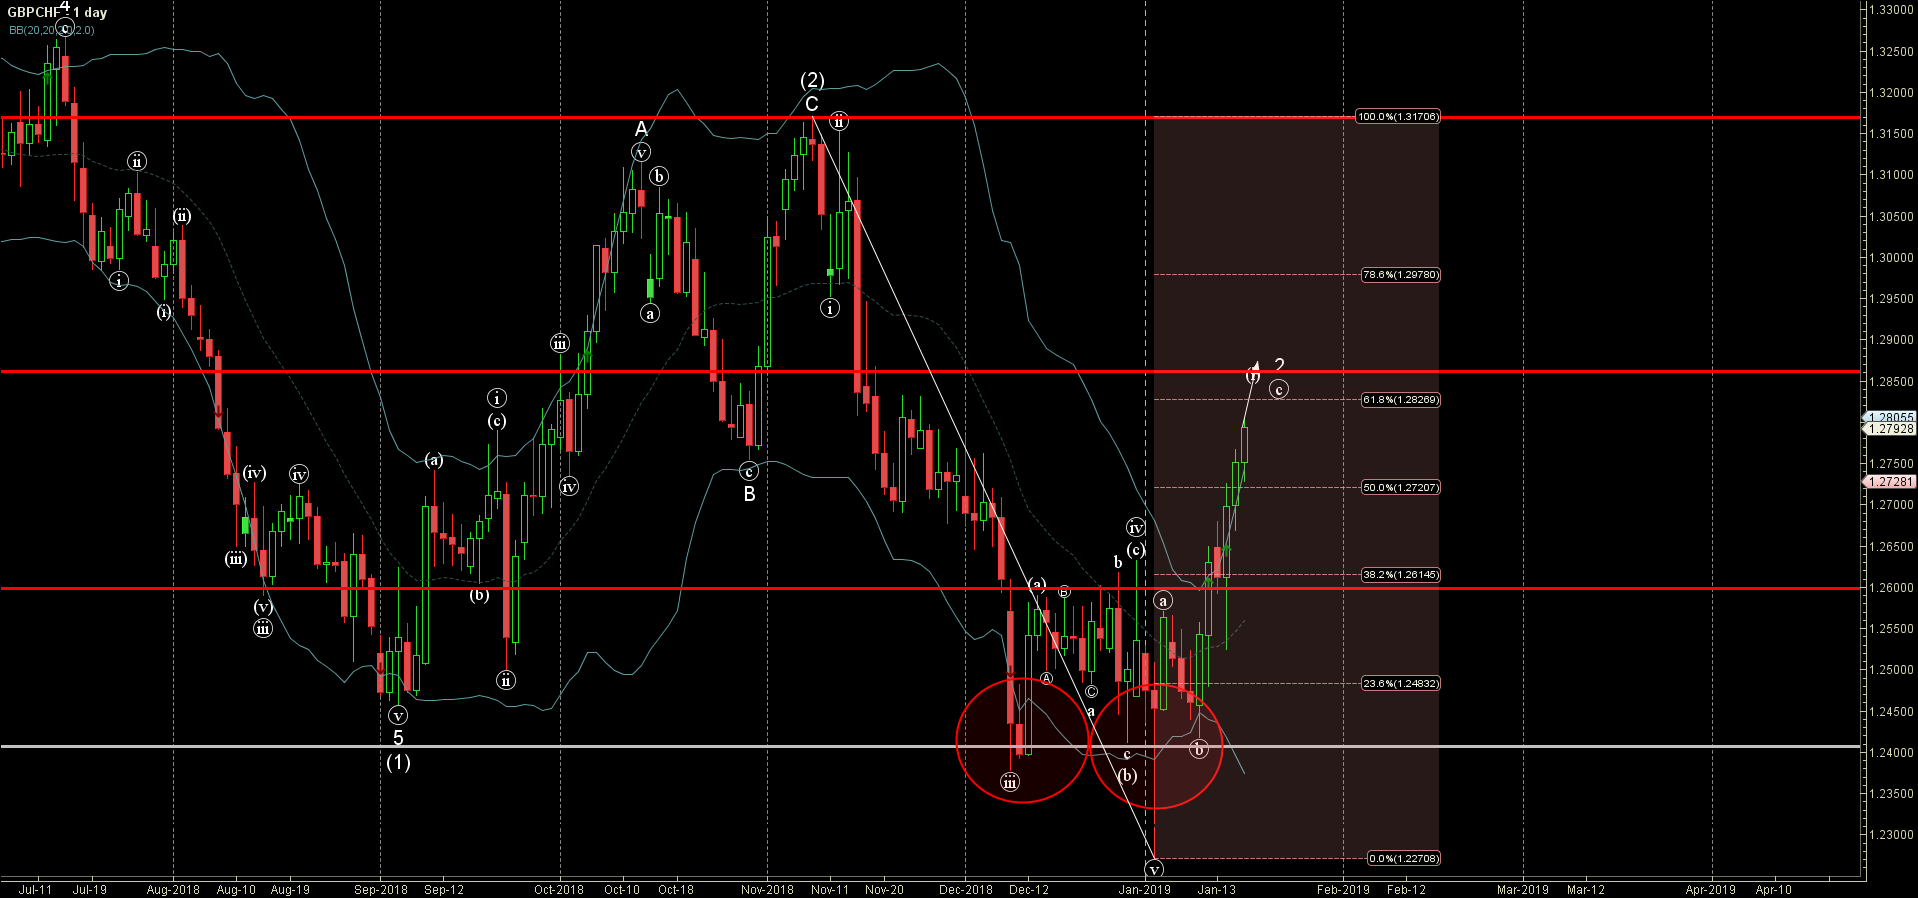
- GBPCHF broke resistance area
- Further gains are likely
GBPCHF continues to rise inside the impulse wave (c) – which previously broke the resistance area lying between the key resistance level 1.2600 (which reversed the pair multiple times in December) and 38.2% Fibonacci correction of the previous sharp downward impulse from November.
The breakout of this resistance area accelerated the active short-term impulse wave (c) – which belongs to the medium-term ABC correction 2 from the start of January.
GBPCHF is expected to rise further and re-test the next resistance level 1.2850 (target price for the completion of the active ABC correction 2).
Related Articles

Intel Wave Analysis 19 April 2024
April 19, 2024 @ 22:12 +03:00

GBPUSD Wave Analysis 19 April 2024
April 19, 2024 @ 22:11 +03:00

EURJPY Wave Analysis 18 April 2024
April 18, 2024 @ 23:09 +03:00

EURUSD Wave Analysis 18 April 2024
April 18, 2024 @ 23:08 +03:00