

Technical analysis
GBPCAD Wave Analysis – 4 May, 2020
May 04, 2020 @ 16:10 +03:00

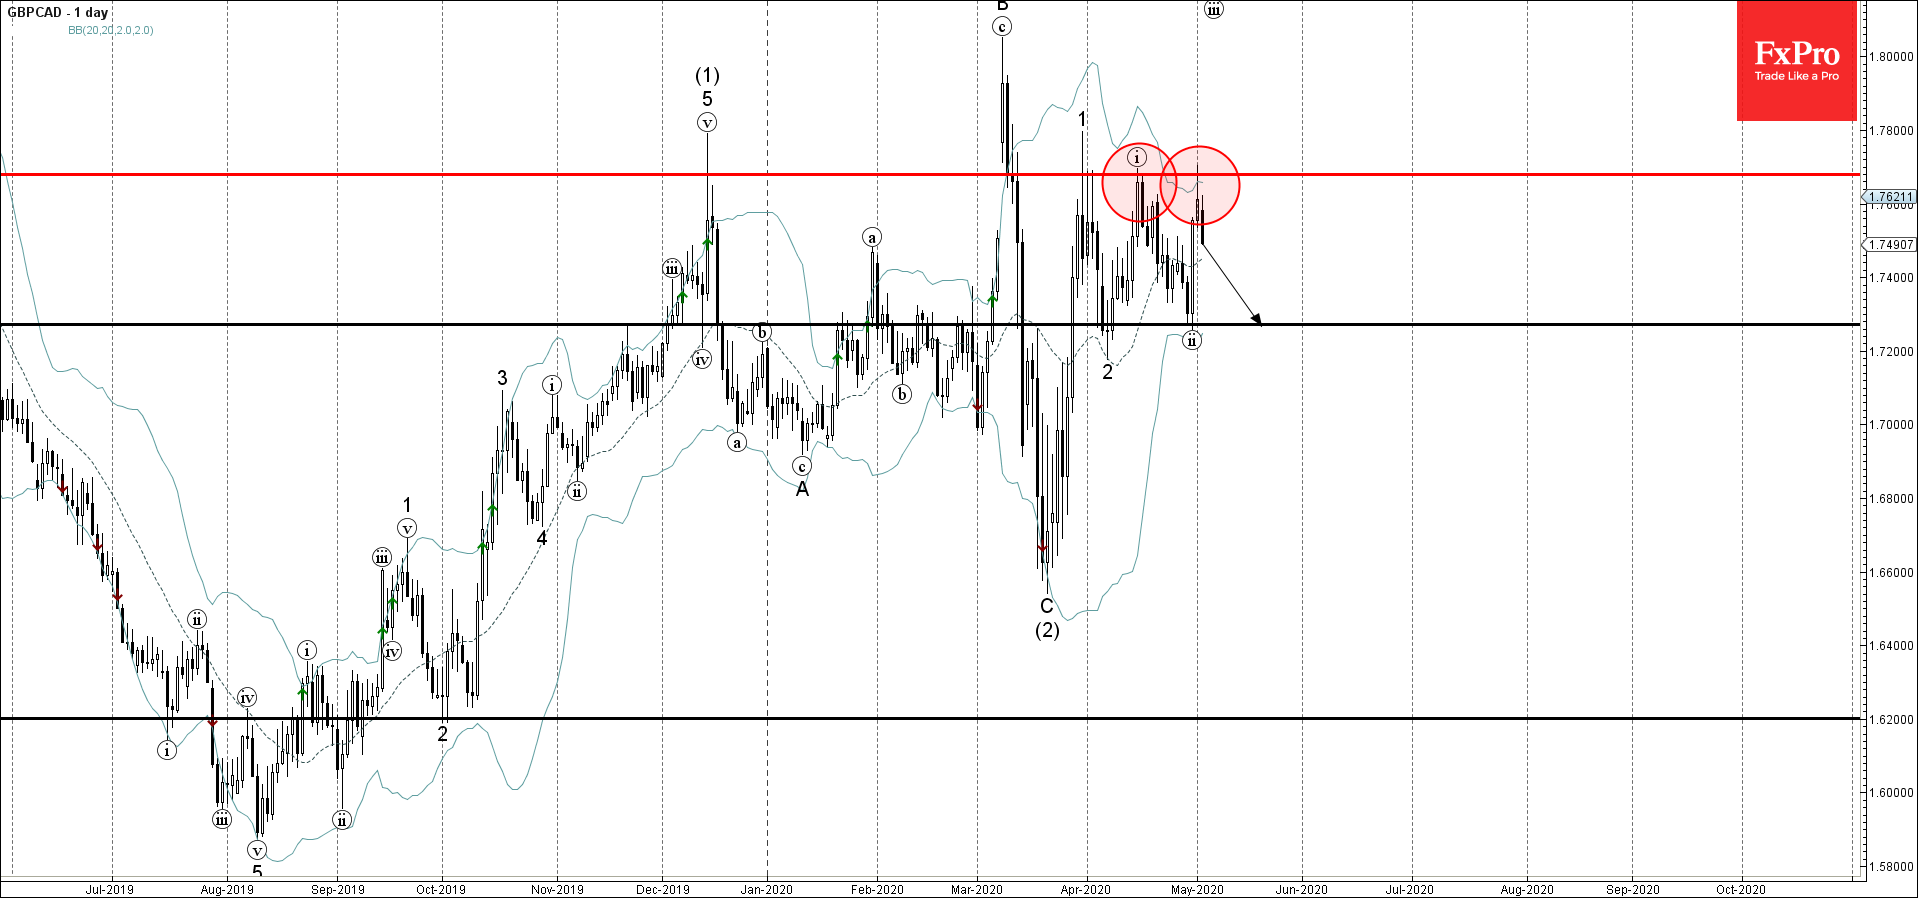
- GBPCAD reversed from resistance zone
- Likely to fall to 1.7270
GBPCAD recently reversed down sharply from the resistance zone located between the resistance level 1.7690 (former monthly high from April) and the upper daily Bollinger Band.
The downward reversal from this resistance zone stopped the previous short-term impulse sequence (iii) from the end of April.
GBPCAD is expected to fall further toward the next support level 1.7270 (low of the previous short-term correction (ii) from last month).
Related Articles

GBPCAD Wave Analysis 25 April 2024
April 25, 2024 @ 20:10 +03:00

GBPAUD Wave Analysis 25 April 2024
April 25, 2024 @ 20:09 +03:00

EURGBP Wave Analysis 24 April 2024
April 24, 2024 @ 21:42 +03:00

EURJPY Wave Analysis 24 April 2024
April 24, 2024 @ 21:40 +03:00