

Technical analysis
GBPCAD Wave Analysis – 24 October , 2018
October 24, 2018 @ 19:22 +03:00
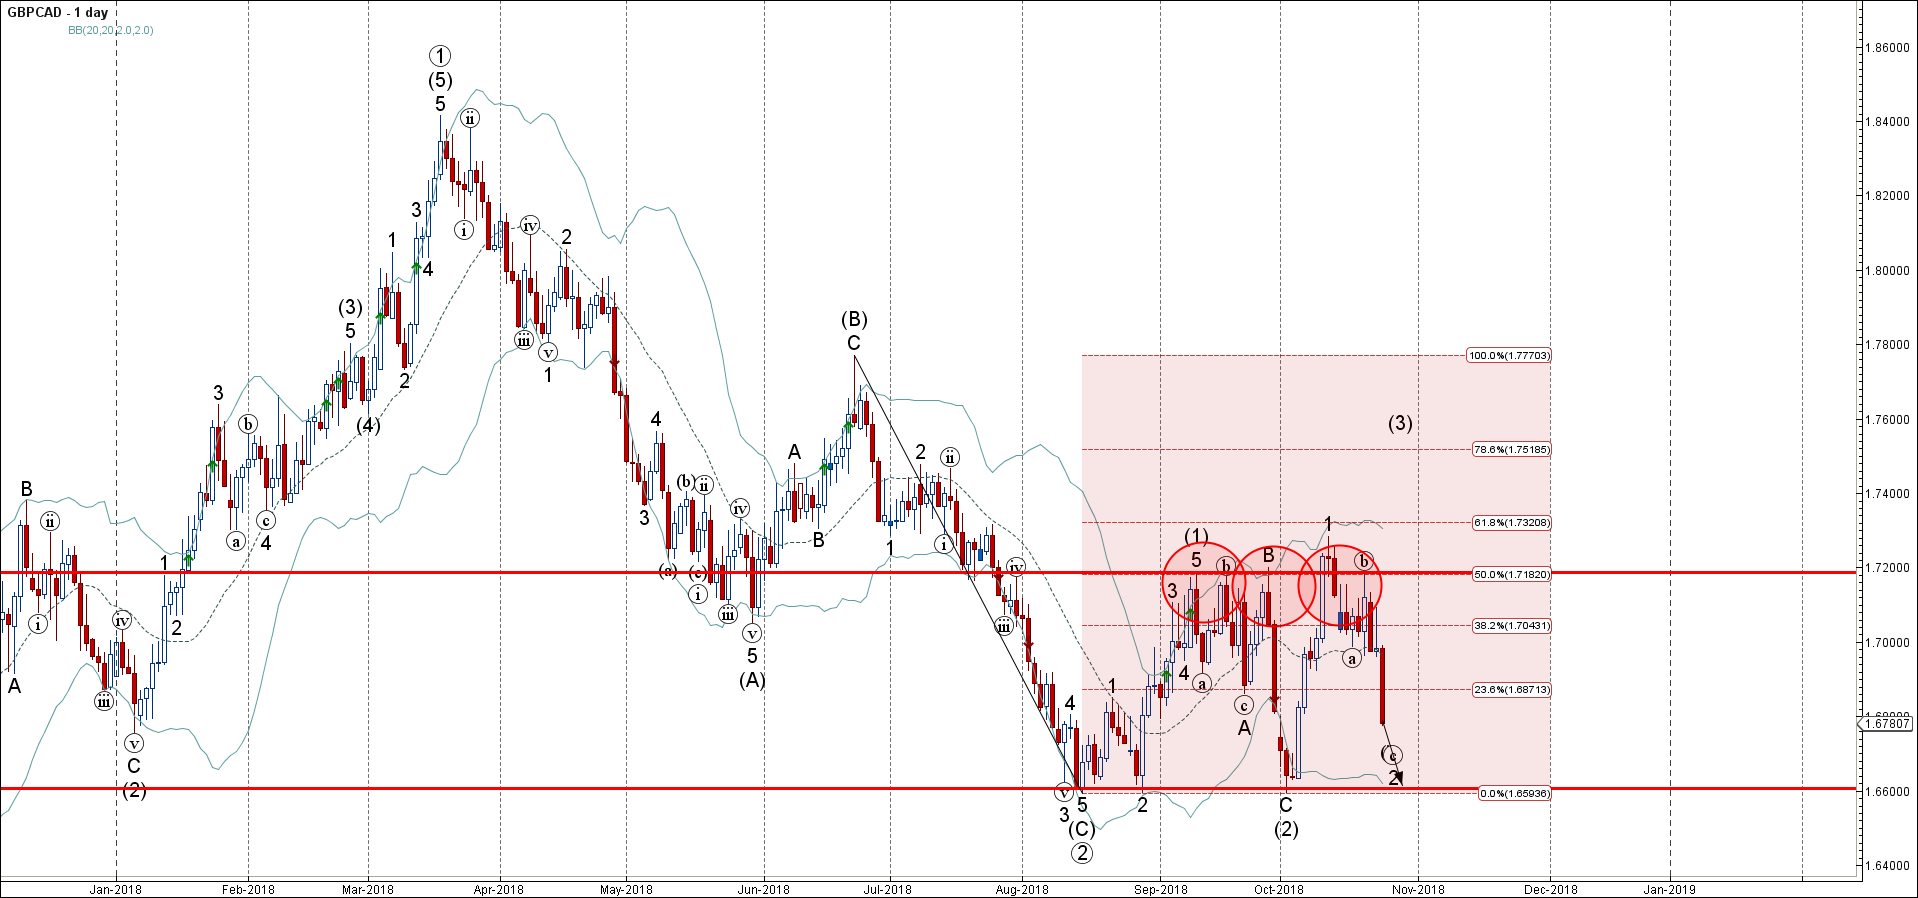
- GBPCAD falling inside short-term impulse wave C
- Further losses are likely
GBPCAD continues to fall inside the short-term impulse wave C, which started recently from the resstance area lying at the intersection of the key resistance level 1.7200 (which has been reversing the price from September) and the upper daily Bollinger Band.
The active impulse wave Cs belongs to the medium-term ABC corrective wave 2 from the middle of October.
GBPCAD is expected to fall further and re-test the next strong support level 1.6600 (low of the previous waves (C), 2 and (2)).
Related Articles

GBPCAD Wave Analysis 25 April 2024
April 25, 2024 @ 20:10 +03:00

GBPAUD Wave Analysis 25 April 2024
April 25, 2024 @ 20:09 +03:00

EURGBP Wave Analysis 24 April 2024
April 24, 2024 @ 21:42 +03:00

EURJPY Wave Analysis 24 April 2024
April 24, 2024 @ 21:40 +03:00