

Technical analysis
GBPCAD Wave Analysis – 15 May, 2020
May 15, 2020 @ 17:52 +03:00

• GBPCAD broke support zone
• Likely to fall to 1.7000
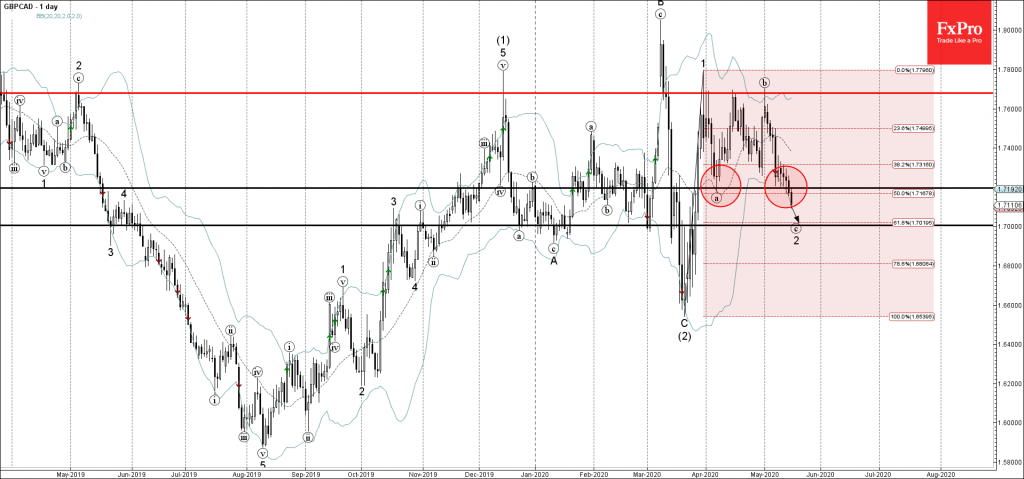
GBPCAD recently broke the support zone lying between the key support level 1.7190 (monthly low from April) and the 50% Fibonacci correction of the previous upward impulse wave 1.
The breakout of this support zone should accelerate the active minor impulse wave (c) of the ABC correction 2 from the end of March.
GBPCAD is likely to fall further toward the next round support level 1.7000 (likely price for the completion of the active wave 2).
Related Articles

USDJPY Wave Analysis 26 April 2024
April 27, 2024 @ 00:00 +03:00

Ebay Wave Analysis 26 April 2024
April 26, 2024 @ 23:59 +03:00

GBPCAD Wave Analysis 25 April 2024
April 25, 2024 @ 20:10 +03:00

GBPAUD Wave Analysis 25 April 2024
April 25, 2024 @ 20:09 +03:00