

Technical analysis
GBPCAD Wave Analysis – 15 April, 2019
April 15, 2019 @ 18:53 +03:00

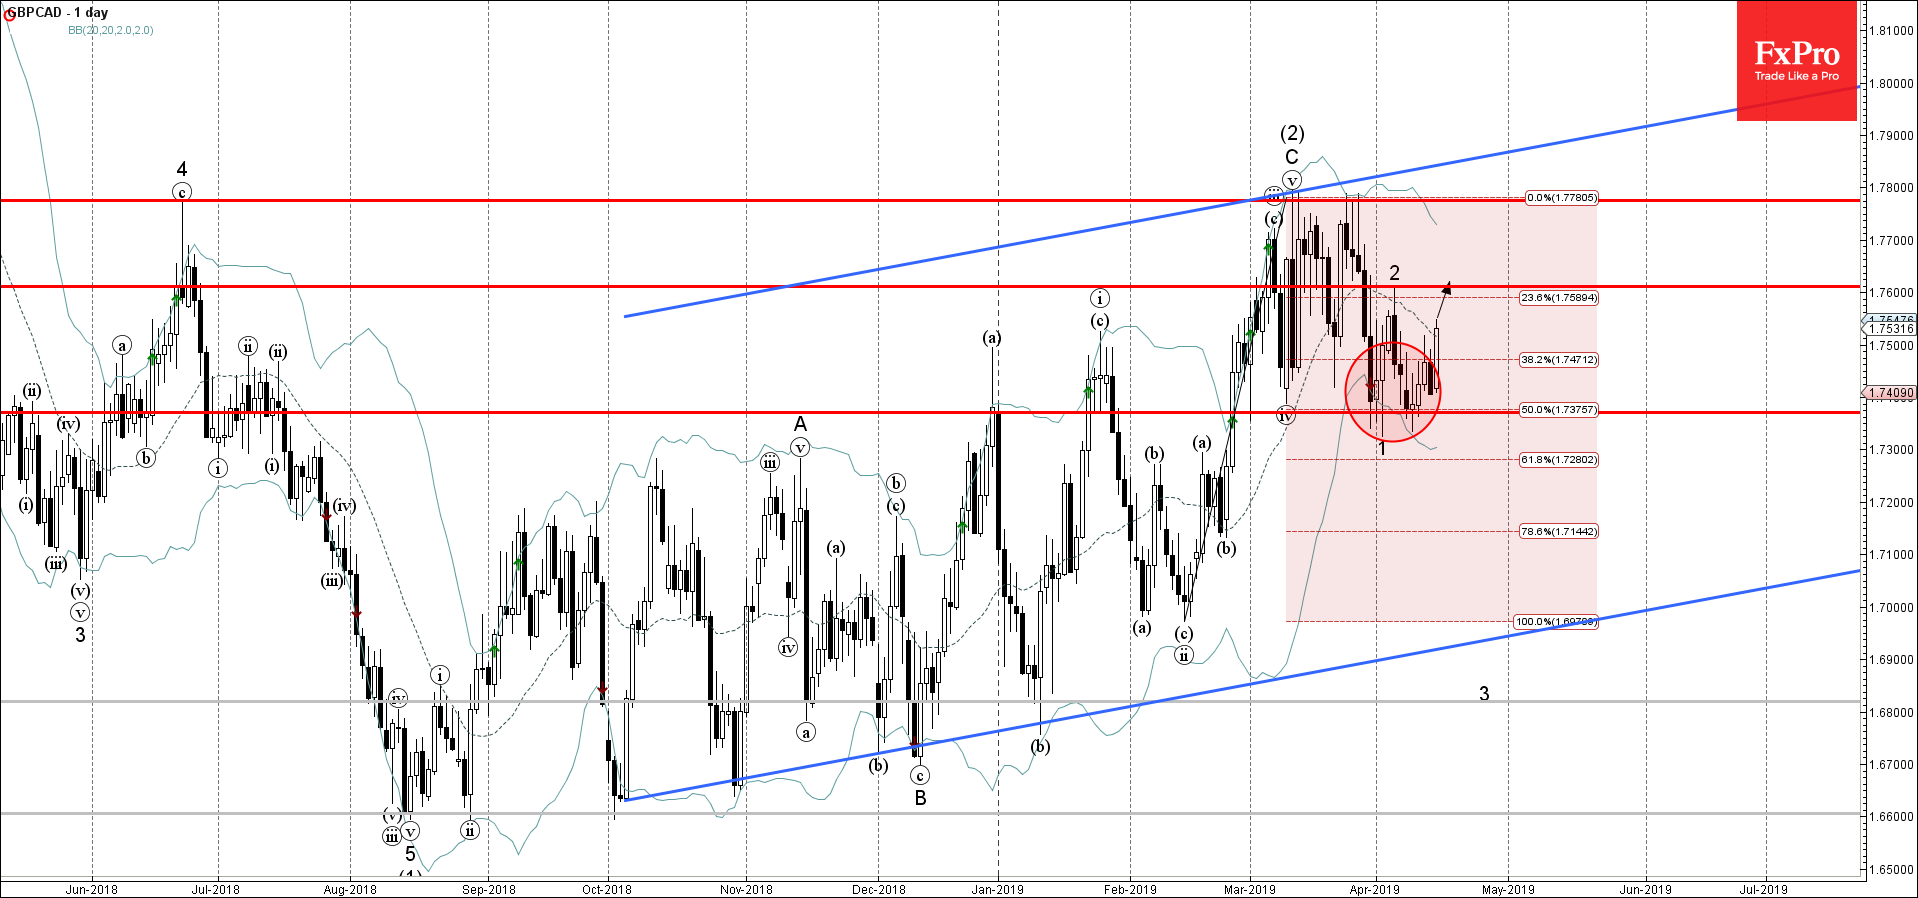
- GBPCAD reversed from support area
- Further gains are likely
GBPCAD recently reversed up with the two consecutive daily Morning Stars from the support area lying between the key support level 1.7370 (which has been reversing the price from February), lower daily Bollinger Band and the 50% Fibonacci correction of the previous upward impulse from February.
The upward reversal from this support area stopped the earlier short-term downward impulse wave 3.
GBPCAD is expected to rise further and re-test the next resistance level 1.7600 (top of the previous correction 2).
Related Articles

USDJPY Wave Analysis 26 April 2024
April 27, 2024 @ 00:00 +03:00

Ebay Wave Analysis 26 April 2024
April 26, 2024 @ 23:59 +03:00

GBPCAD Wave Analysis 25 April 2024
April 25, 2024 @ 20:10 +03:00

GBPAUD Wave Analysis 25 April 2024
April 25, 2024 @ 20:09 +03:00