

Technical analysis
GBPCAD Wave Analysis – 13 July, 2020
July 13, 2020 @ 17:26 +03:00

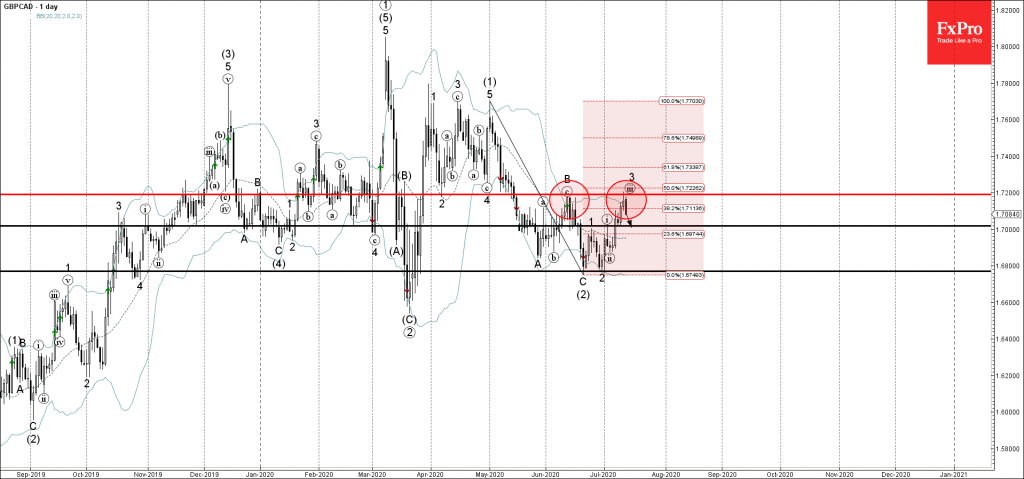
• GBPCAD reversed from resistance area
• Likely to fall to 1.7000
GBPCAD recently reversed down from the resistance area located between the resistance level 1.7200 (top of B-wave from June), upper daily Bollinger Band and the 50% Fibonacci correction of the previous downward wave (2) from April.
The downward reversal from this resistance area stopped two previous sharp impulse waves (iii) and 3.
GBPCAD can be expected to fall further toward the next round support level 1.7000 (former top of waves 1 and (i)).
Related Articles

EURJPY Wave Analysis 18 April 2024
April 18, 2024 @ 23:09 +03:00

EURUSD Wave Analysis 18 April 2024
April 18, 2024 @ 23:08 +03:00

WTI Wave Analysis 17 April 2024
April 17, 2024 @ 22:40 +03:00

EURGBP Wave Analysis 17 April 2024
April 17, 2024 @ 22:38 +03:00