

Technical analysis
GBPCAD Wave Analysis – 12 June, 2020
June 12, 2020 @ 17:39 +03:00

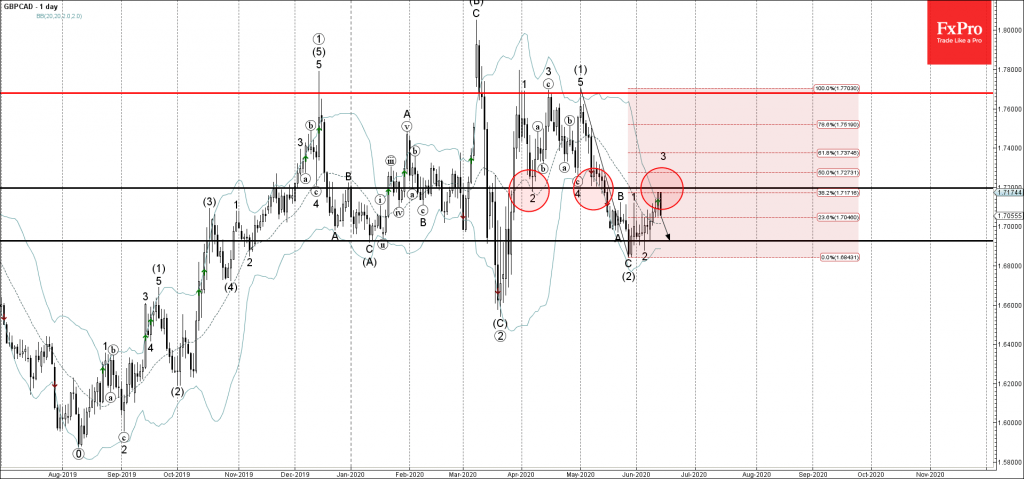
• GBPCAD reversed from resistance zone
• Likely to fall to 1.6890
GBPCAD today reversed down from the resistance area located between the pivotal resistance level 1.7200 (former support from April and May), upper daily Bollinger Band and the 38.2% Fibonacci retracement of the previous ABC correction (2) from the start of May.
The downward reversal from this resistance zone stopped the earlier short-term impulse wave 3.
GBPCAD is likely to fall further toward the next support level 1.6890 (which stopped the previous short-term correction 2).
Related Articles

EURGBP Wave Analysis 24 April 2024
April 24, 2024 @ 21:42 +03:00

EURJPY Wave Analysis 24 April 2024
April 24, 2024 @ 21:40 +03:00

WTI crude oil Wave Analysis 23 April 2024
April 23, 2024 @ 22:47 +03:00

USDCAD Wave Analysis 23 April 2024
April 23, 2024 @ 22:46 +03:00