

Technical analysis
GBPCAD Wave Analysis – 10 May, 2019
May 10, 2019 @ 17:29 +03:00

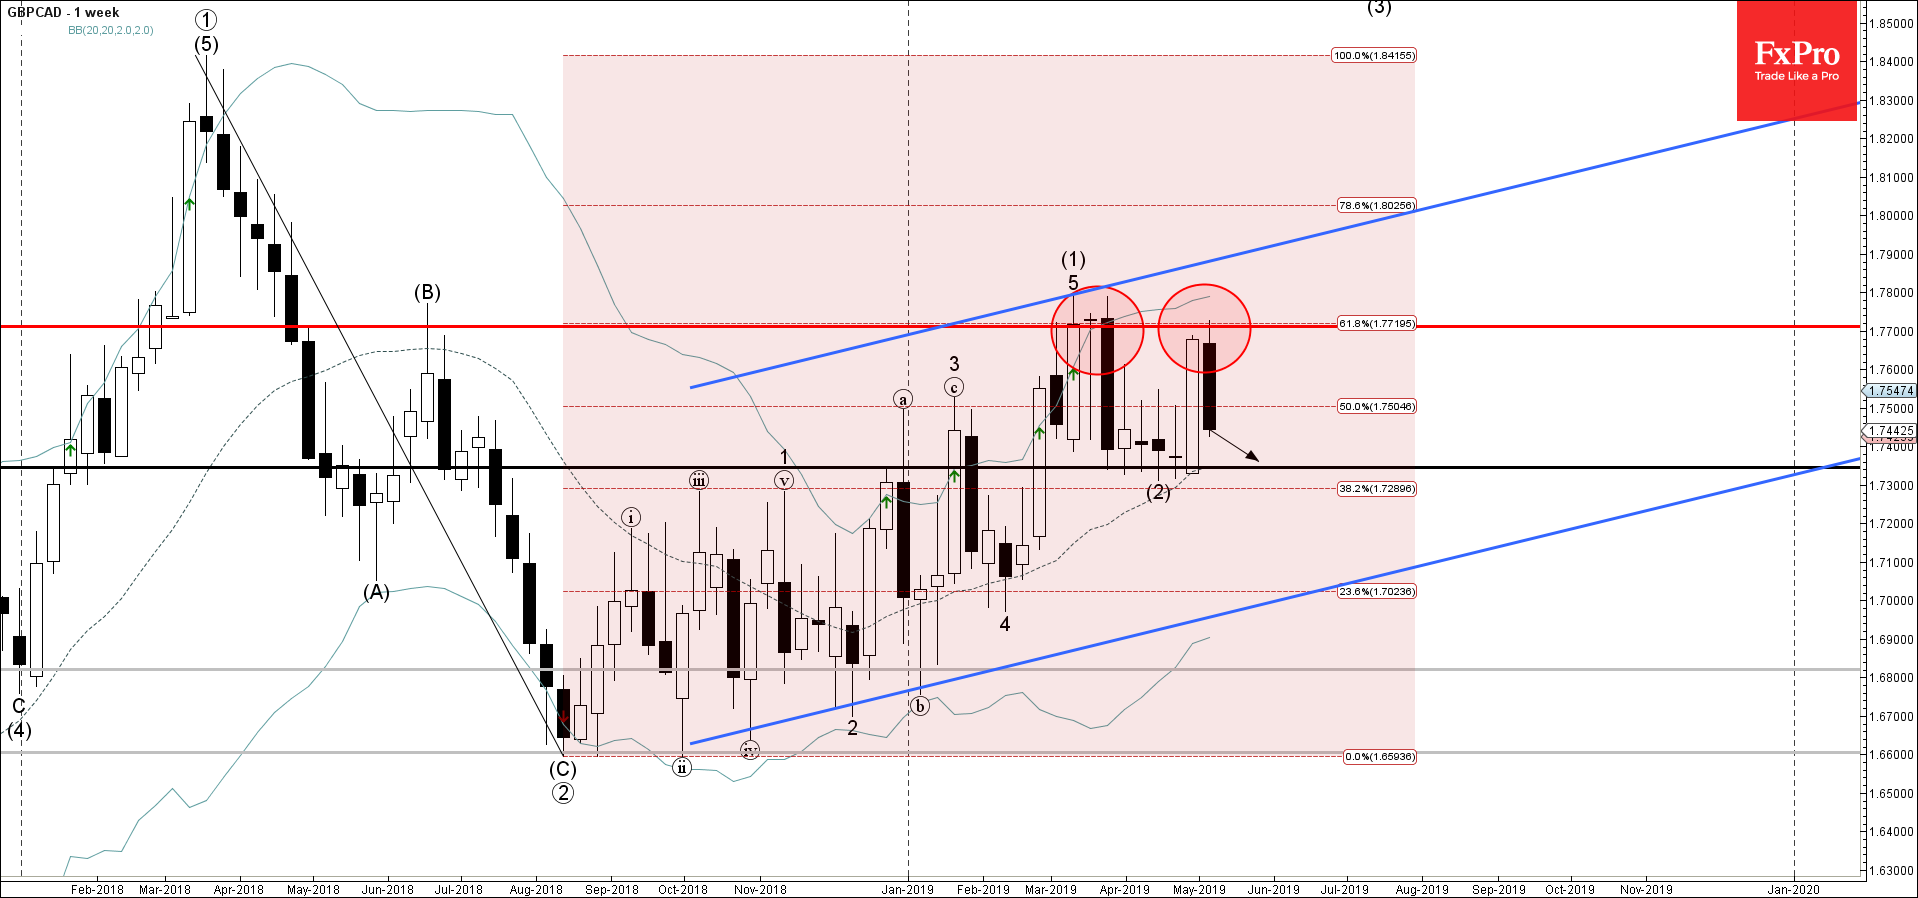
- GBPCAD reversed from resistance area
- Further losses are likely
GBPCAD recently reversed from the resistance area lying between the resistance level 1.7700 (which also reversed the price with the weekly Evening Star in April) and the upper weekly Bollinger Band.
This resistance area was further strengthened by the 61.8% Fibonacci correction of the previous weekly ABC correction from March of 2018.
GBPCAD is expected to fall further and retest the next key support level 1.7340 (which reversed the price multiple times in the last few weeks).
Related Articles

EURJPY Wave Analysis 18 April 2024
April 18, 2024 @ 23:09 +03:00

EURUSD Wave Analysis 18 April 2024
April 18, 2024 @ 23:08 +03:00

WTI Wave Analysis 17 April 2024
April 17, 2024 @ 22:40 +03:00

EURGBP Wave Analysis 17 April 2024
April 17, 2024 @ 22:38 +03:00