

Technical analysis
GBPCAD Wave Analysis – 01 February, 2019
February 01, 2019 @ 17:51 +03:00

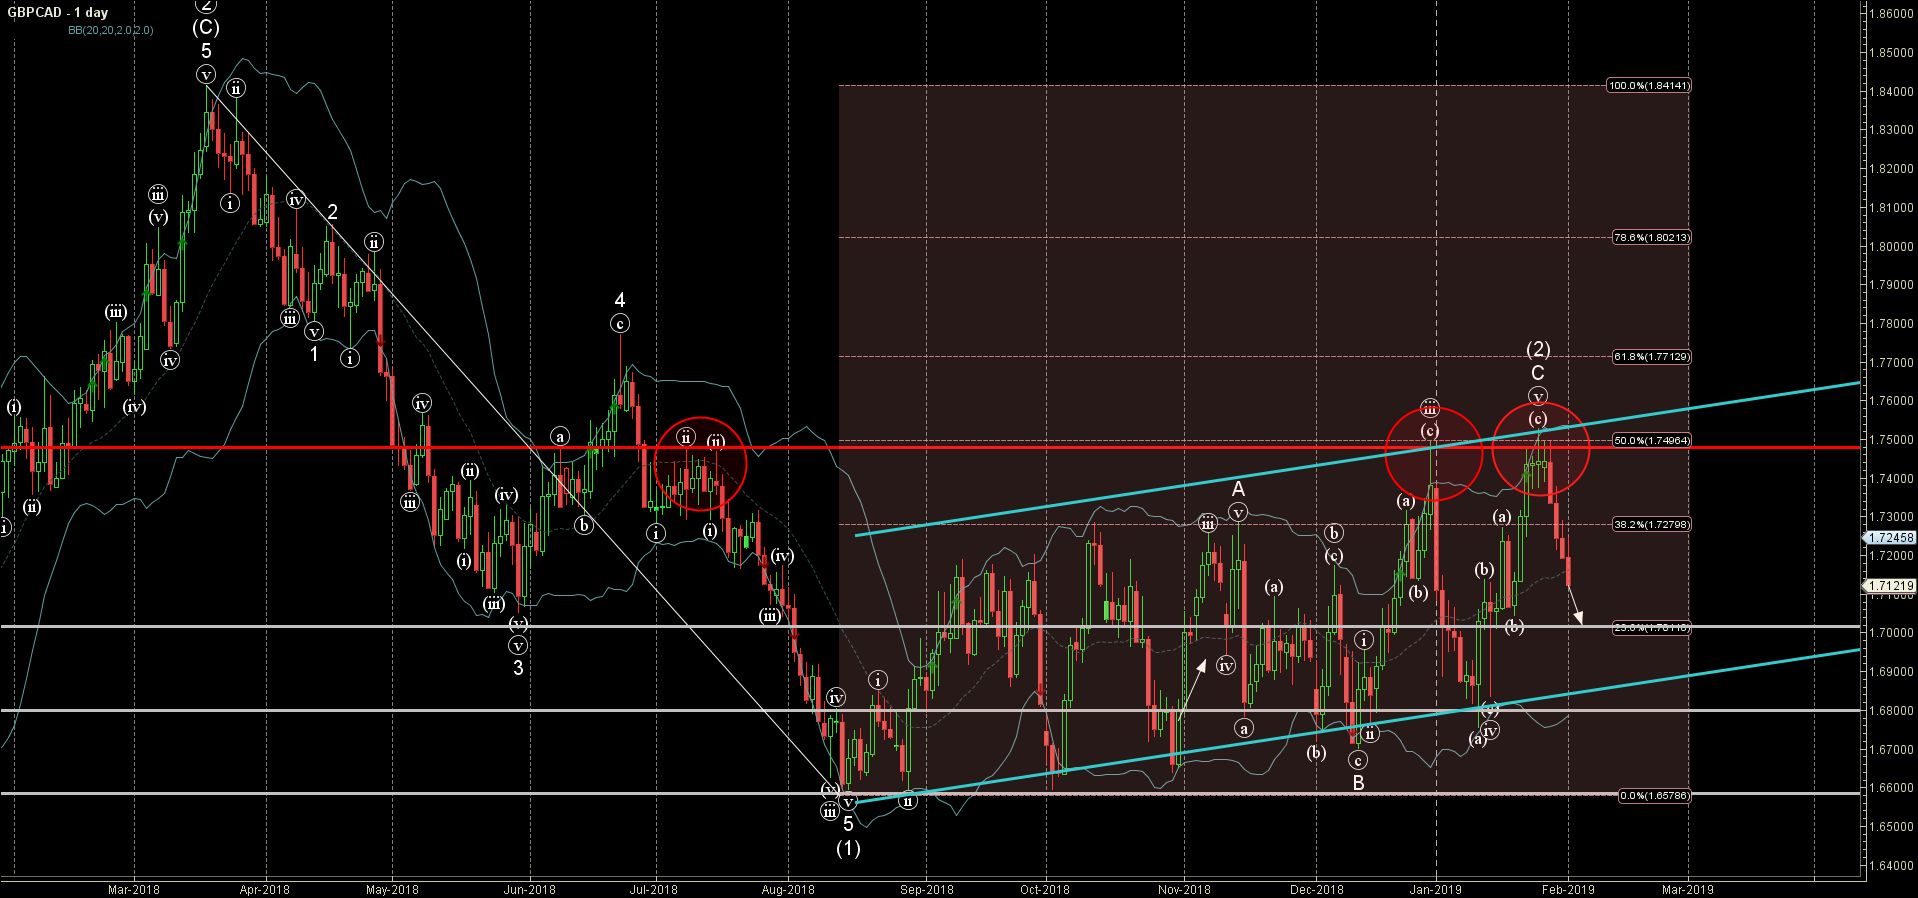
- GBPCAD reversed from resistance area
- Further losses are likely
GBPCAD recently reversed down from the resistance area lying between the resistance level 1.7500 (which has been reversing the price from July), resistance trendline of the wide daily up channel from August and the 50% Fibonacci correction of the previous downward impulse (1) from March.
The downward reversal from this resistance area started the active medium-term impulse wave (3).
GBPCAD is expected to fall further and re-test the next support level 1.7000 (low of the previous short-term corrective wave (b)).
Related Articles

WTI Wave Analysis 17 April 2024
April 17, 2024 @ 22:40 +03:00

EURGBP Wave Analysis 17 April 2024
April 17, 2024 @ 22:38 +03:00

Citigroup Wave Analysis 16 April 2024
April 16, 2024 @ 22:06 +03:00

USDJPY Wave Analysis 16 April 2024
April 16, 2024 @ 22:05 +03:00