

Technical analysis
GBPAUD Wave Analysis – 10 Janaury, 2019
January 10, 2019 @ 16:10 +03:00

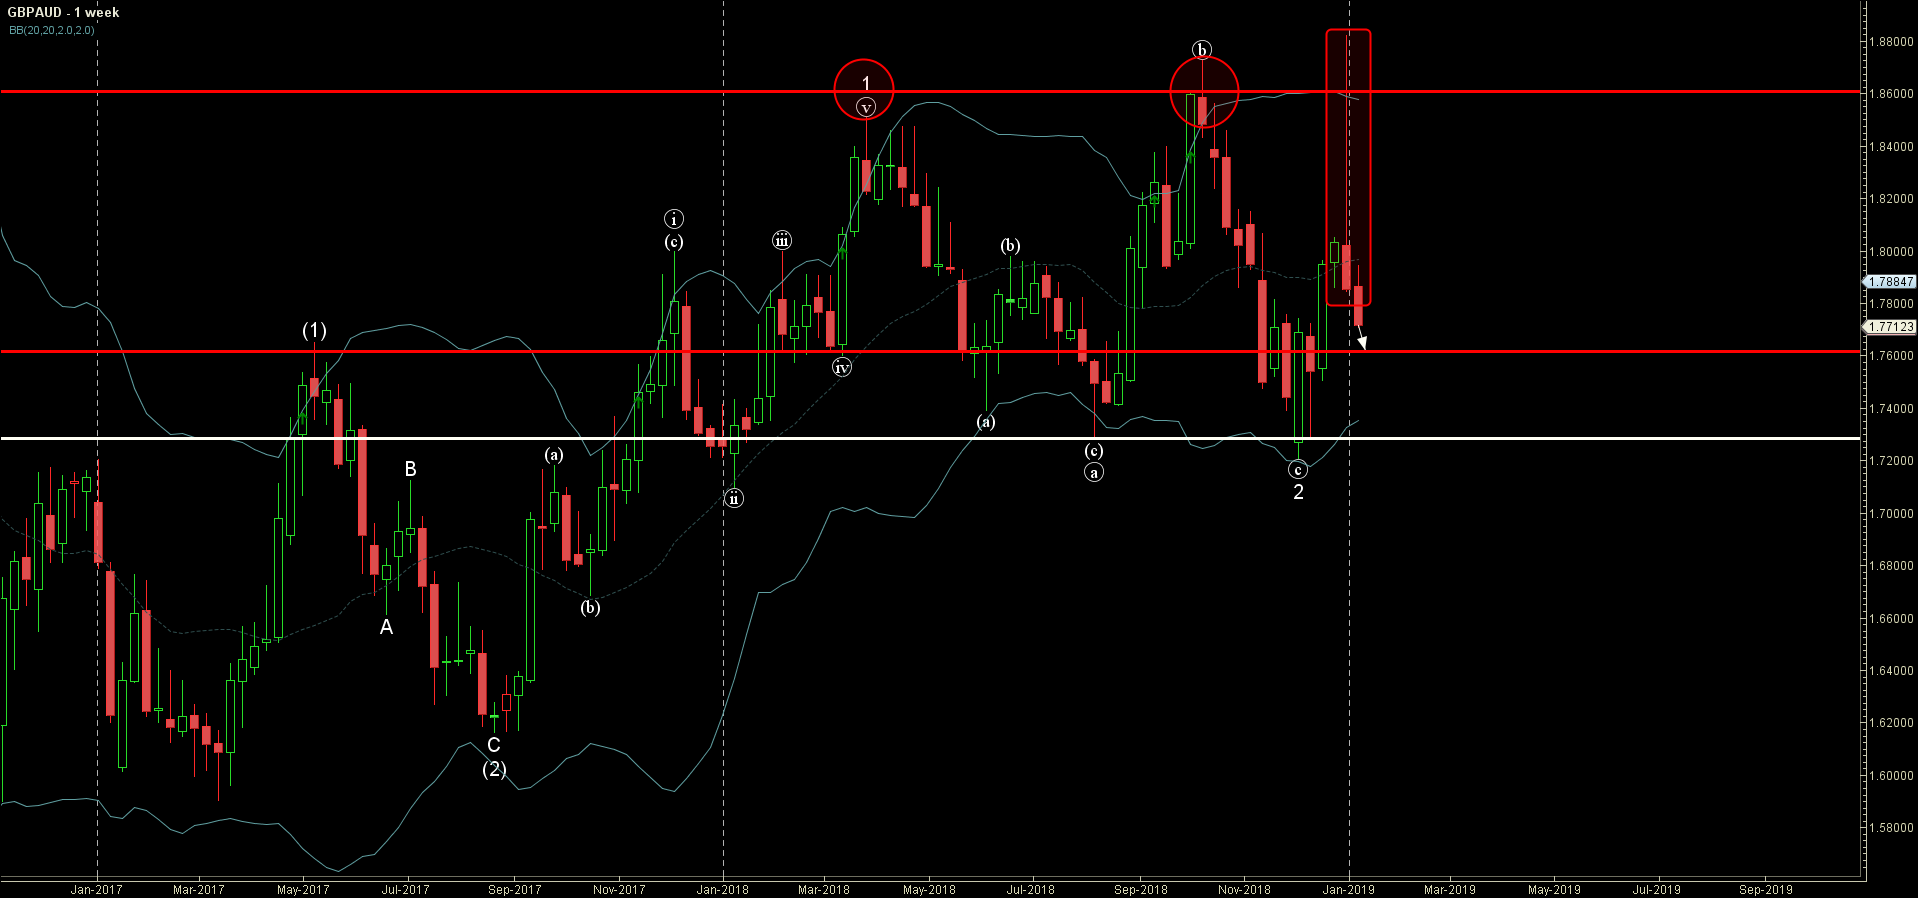
- GBPAUD reversed from resistance area
- Further losses are likely
GBPAUD recently reversed down from the strong resistance area located between the long-term resistance level 1.8600 (which has been reversing the price from the start of 2018) and the upper weekly Bollinger Band.
The downward reversal from this resistance area created the strong Japanese candlesticks reversal pattern Falling Star.
GBPAUD is expected to fall further and re-test the next support level 1.7600 – the breakout of which can lead to further losses toward the next strong support level 1.7280.
Related Articles

GBPCAD Wave Analysis 25 April 2024
April 25, 2024 @ 20:10 +03:00

GBPAUD Wave Analysis 25 April 2024
April 25, 2024 @ 20:09 +03:00

EURGBP Wave Analysis 24 April 2024
April 24, 2024 @ 21:42 +03:00

EURJPY Wave Analysis 24 April 2024
April 24, 2024 @ 21:40 +03:00