

Technical analysis
Fedex Wave Analysis – 14 February, 2020
February 14, 2020 @ 17:32 +03:00
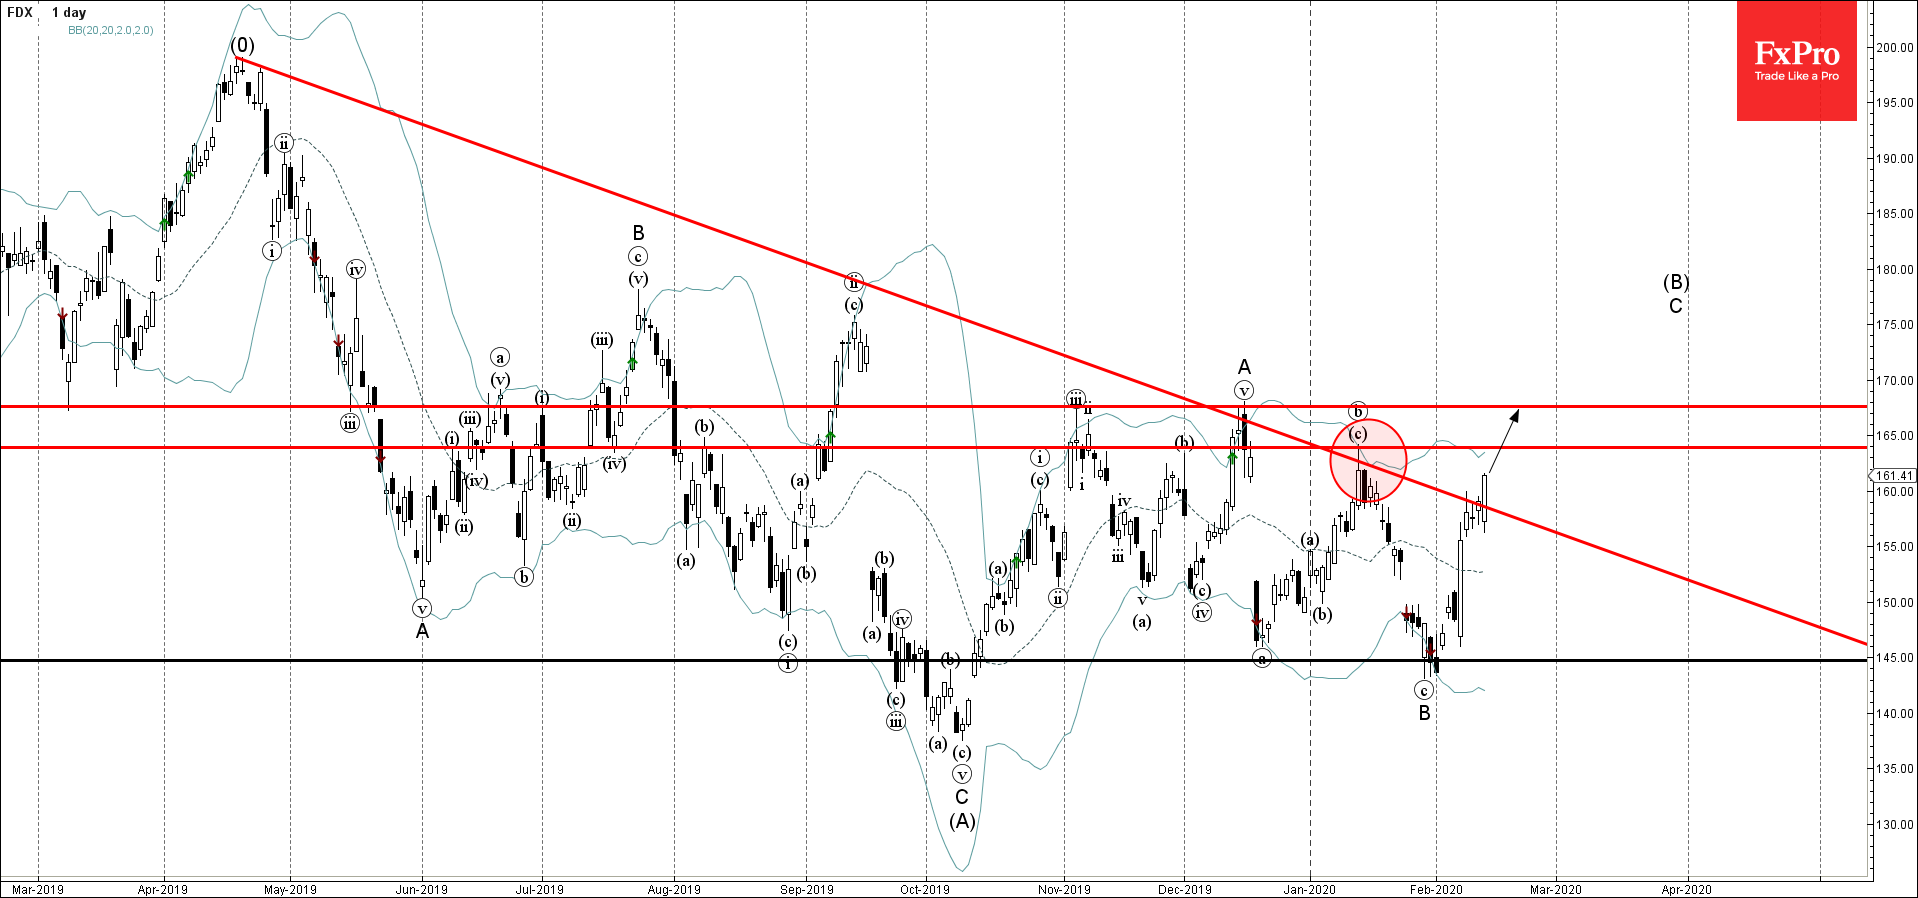
- Fedex broke multi-month resistance trendline
- Likely to rise to 163.90
Fedex recently broke through the multi-month resistance trendline which has been reversing the price from April of 2019 – as can be seen below.
The breakout of this resistance trendline continues the active short-term impulse wave C of the ABC correction (B) from last October.
Fedex is likely to rise further in the active waves C and (B) toward the next resistance level 163.90 (top of the previous wave (b)) – the breakout of which can lead to further gains toward 167.60 (top of the earlier correction A).
Related Articles

USDJPY Wave Analysis 26 April 2024
April 27, 2024 @ 00:00 +03:00

Ebay Wave Analysis 26 April 2024
April 26, 2024 @ 23:59 +03:00

GBPCAD Wave Analysis 25 April 2024
April 25, 2024 @ 20:10 +03:00

GBPAUD Wave Analysis 25 April 2024
April 25, 2024 @ 20:09 +03:00