

Technical analysis
ExxonMobil Wave Analysis – 28 February, 2020
February 28, 2020 @ 17:46 +03:00
- ExxonMobil under bearish pressure
- Likely to fall to 48.00
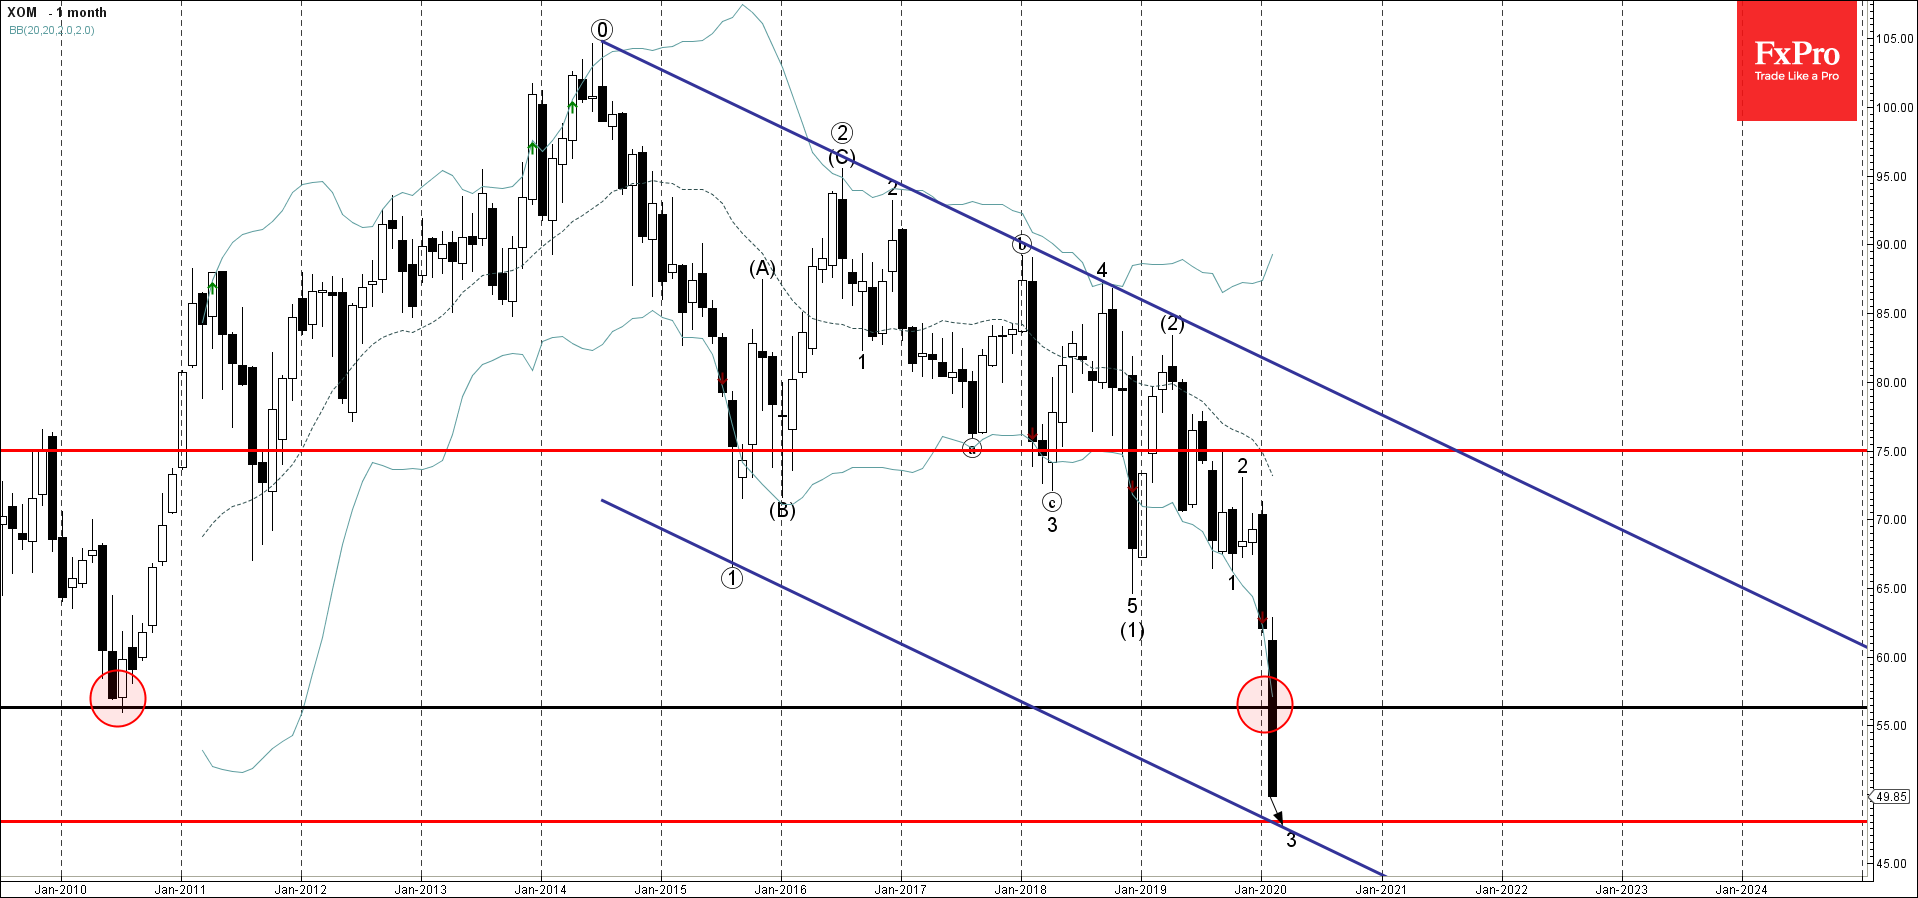
ExxonMobil recently broke below the powerful multi-year round support level 56.30 (which reversed the price in the middle of 2010 as can be seen from the monthly ExxonMobil chart below).
The breakout of the support level 56.30 (which is aligned with the strong multi-year downtrend) accelerated the active monthly impulse waves 3 and (3).
ExxonMobil is likely to fall further toward the next support level 48.00 (the target for the completion of the active impulse wave 3).
Related Articles

Intel Wave Analysis 19 April 2024
April 19, 2024 @ 22:12 +03:00

GBPUSD Wave Analysis 19 April 2024
April 19, 2024 @ 22:11 +03:00

EURJPY Wave Analysis 18 April 2024
April 18, 2024 @ 23:09 +03:00

EURUSD Wave Analysis 18 April 2024
April 18, 2024 @ 23:08 +03:00