

Technical analysis
Exxon Mobil Wave Analysis – 24 January, 2020
January 24, 2020 @ 17:48 +03:00
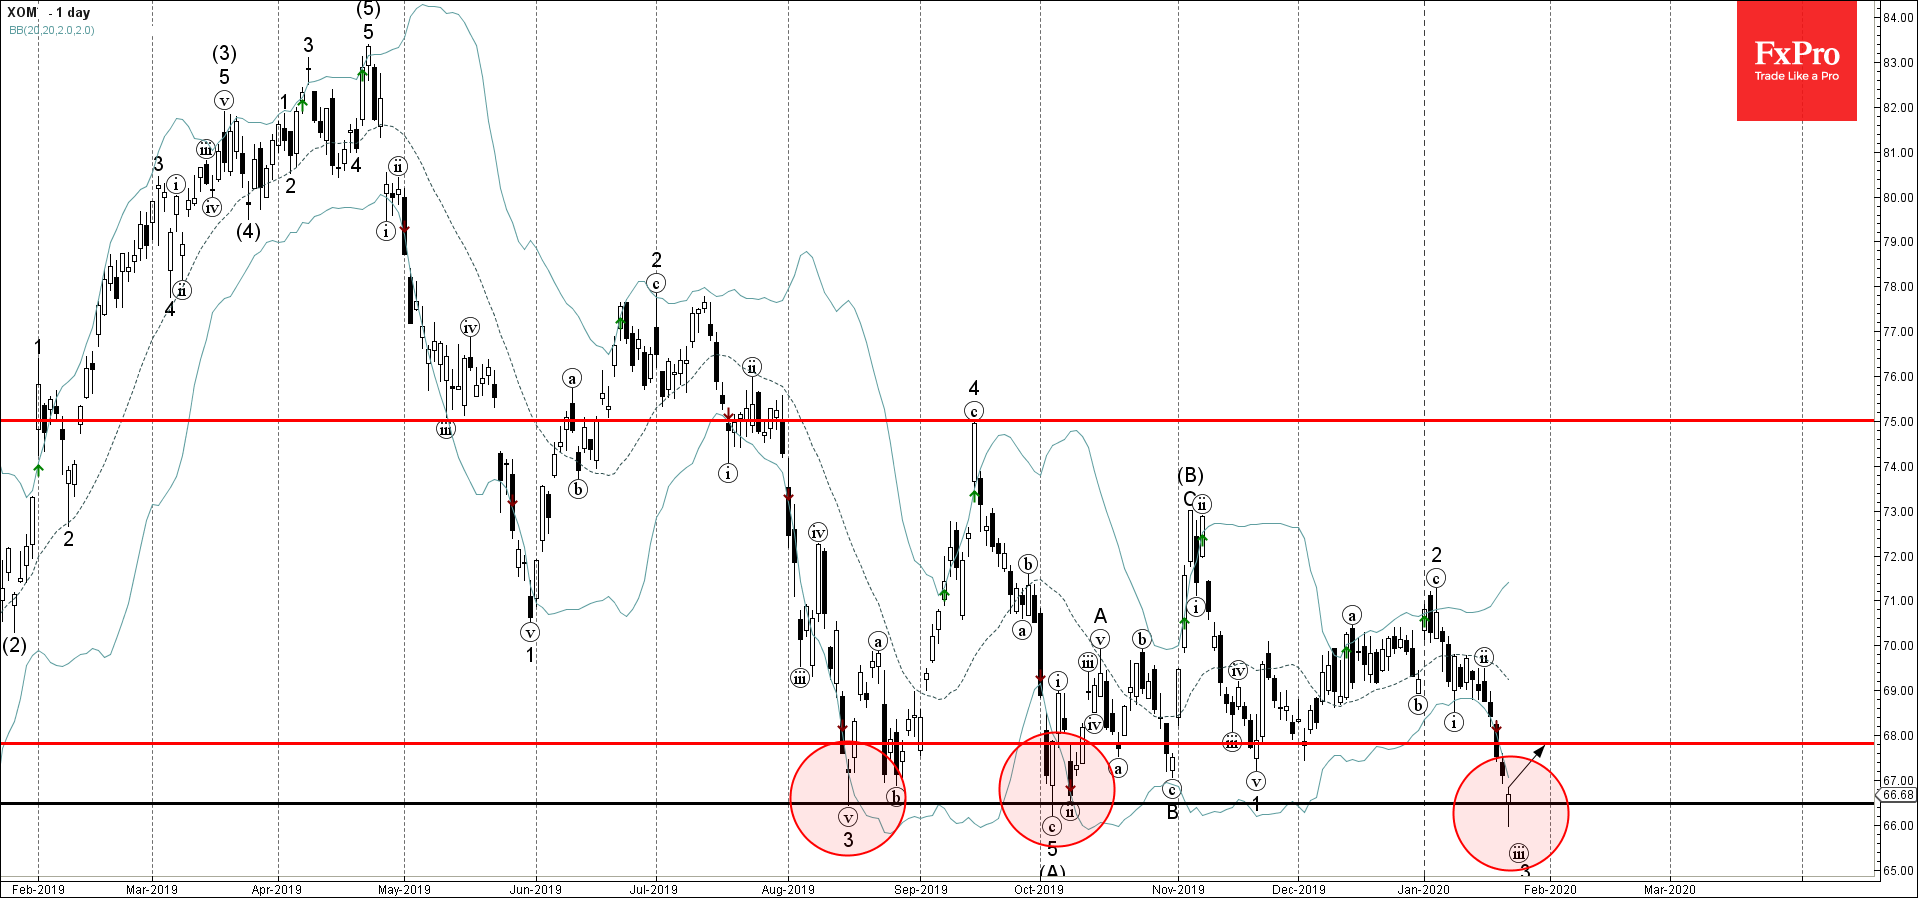
- Exxon Mobil reversed from support area
- Likely to rise to 68.00
Exxon Mobil recently reversed up from support area lying between the key support level 66.50 (which has been reversing the price from August) and the lower daily Bollinger Band.
The upward reversal from this support area created the daily Japanese candlesticks reversal pattern Hammer.
Given the strength of the aforementioned support area – Exxon Mobil is likely to rise further toward the next resistance level 68.00 (former support from December).
Related Articles

WTI crude oil Wave Analysis 23 April 2024
April 23, 2024 @ 22:47 +03:00

USDCAD Wave Analysis 23 April 2024
April 23, 2024 @ 22:46 +03:00

Intel Wave Analysis 19 April 2024
April 19, 2024 @ 22:12 +03:00

GBPUSD Wave Analysis 19 April 2024
April 19, 2024 @ 22:11 +03:00