

Technical analysis
EURGBP Wave Analysis – 22 March, 2019
March 22, 2019 @ 15:58 +03:00

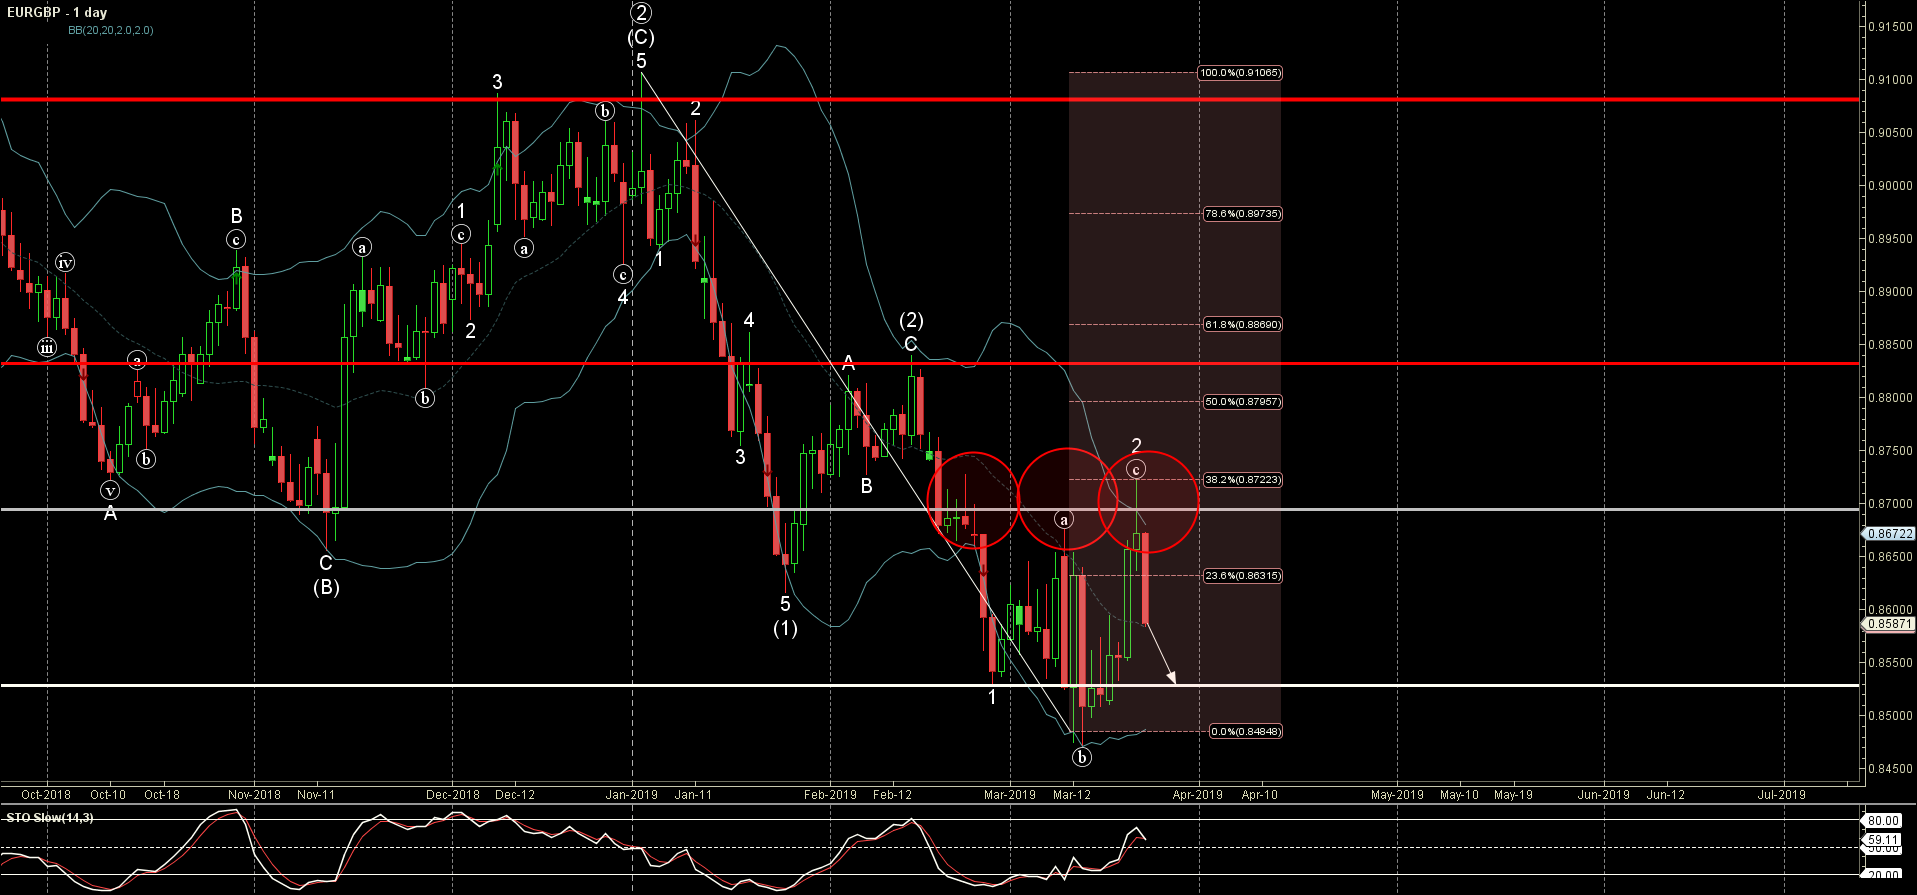
- EURGBP reversed from resistance area
- Further losses are likely
EURGBP recently reversed down with the daily Shooting Star from the resistance area lying between the upper daily Bollinger Band, resistance level 0.8700 and the 38.2% Fibonacci correction of the previous downward impulse from January.
The downward reversal from this resistance area started the active short-term impulse wave 3.
EURGBP is expected to fall further and re-test the next support level 0.8530.
Related Articles

GBPCAD Wave Analysis 25 April 2024
April 25, 2024 @ 20:10 +03:00

GBPAUD Wave Analysis 25 April 2024
April 25, 2024 @ 20:09 +03:00

EURGBP Wave Analysis 24 April 2024
April 24, 2024 @ 21:42 +03:00

EURJPY Wave Analysis 24 April 2024
April 24, 2024 @ 21:40 +03:00