

Technical analysis
EURCAD Wave Analysis – 12 May, 2020
May 12, 2020 @ 17:48 +03:00

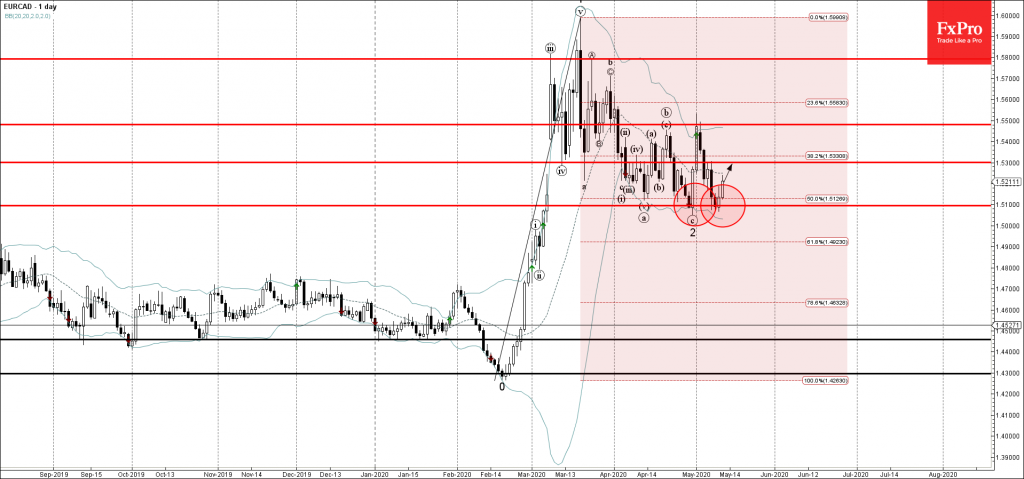
• EURCAD reversed from support area
• Likely to rise to 1.5300
EURCAD recently reversed up from the support zone located between the key support level 1.5100 (low of the previous ABC correction 2), lower daily Bollinger Band and the 50% Fibonacci correction of the previous upward impulse from February.
The upward reversal from this support area created the daily Japanese candlesticks reversal pattern Bullish Engulfing.
EURCAD is expected to rise further toward the next resistance level 1.5300 (top of the previous minor correction from the start of May).
Related Articles

EURGBP Wave Analysis 24 April 2024
April 24, 2024 @ 21:42 +03:00

EURJPY Wave Analysis 24 April 2024
April 24, 2024 @ 21:40 +03:00

WTI crude oil Wave Analysis 23 April 2024
April 23, 2024 @ 22:47 +03:00

USDCAD Wave Analysis 23 April 2024
April 23, 2024 @ 22:46 +03:00