

Technical analysis
EURCAD Wave Analysis – 12 March, 2020
March 12, 2020 @ 17:52 +03:00

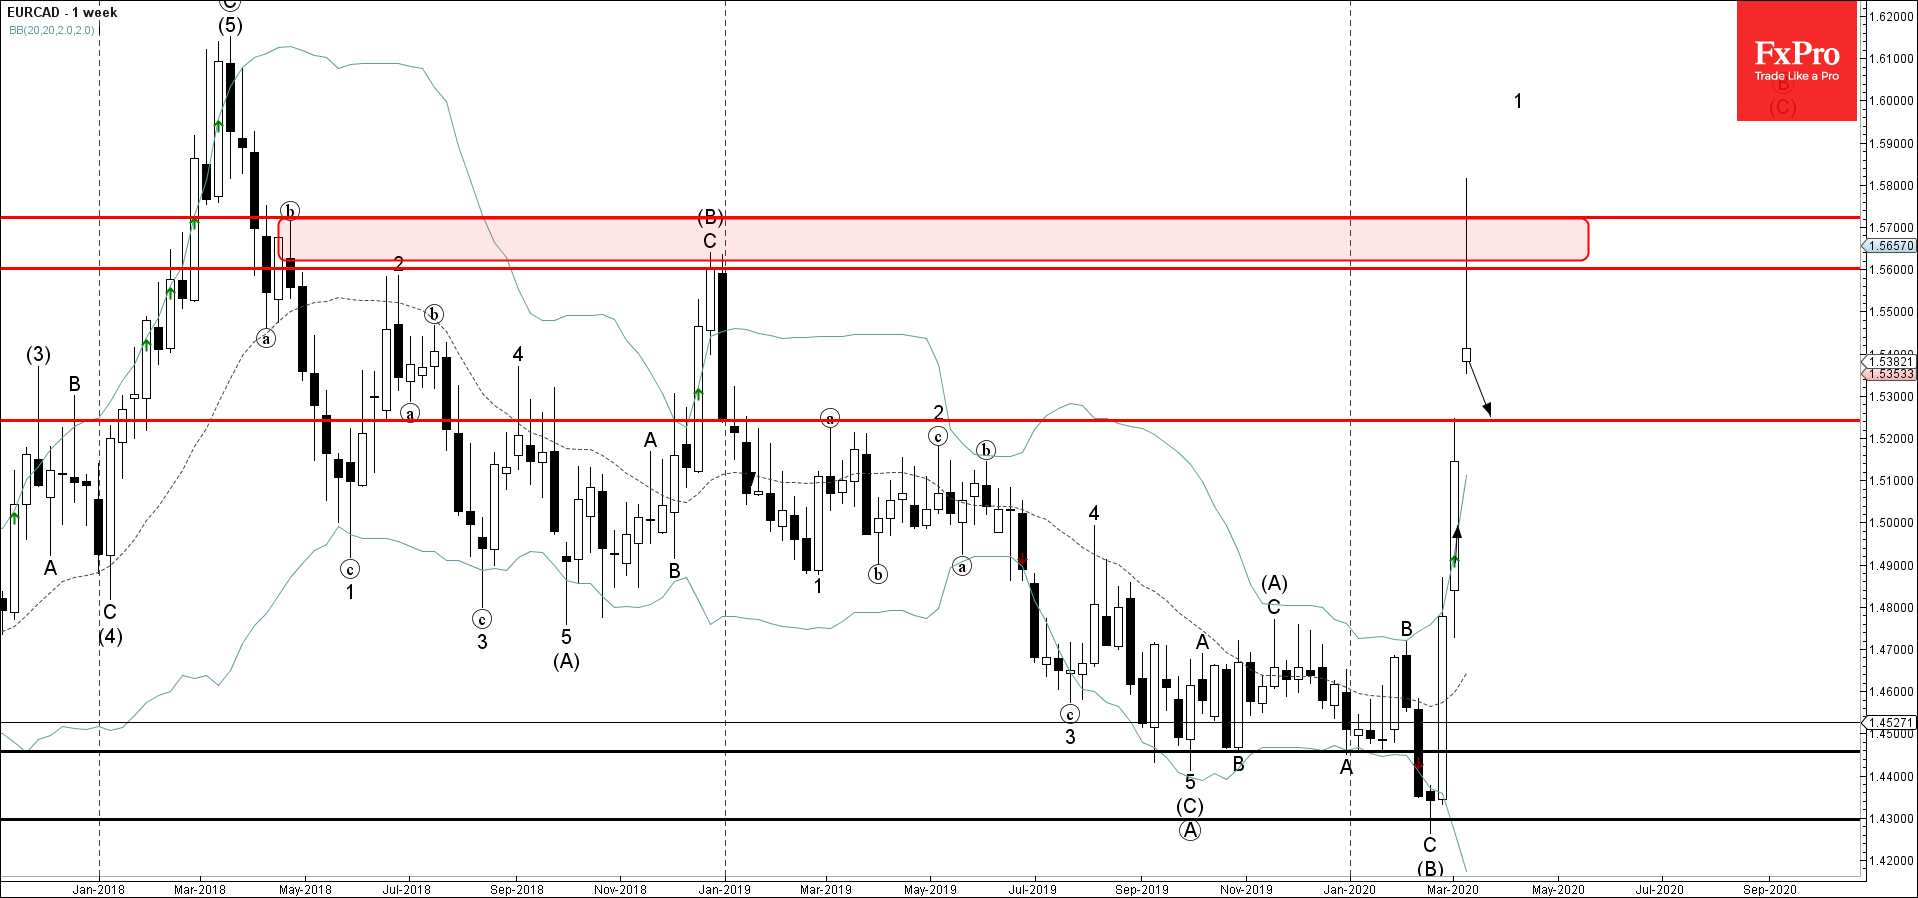
- EURCAD reversed from resistance area
- Likely to fall to 1.5240
EURCAD recently reversed down sharply from the resistance area lying between the resistance level 1.5600 (which reversed the price at the end of 2018), resistance level 1.5700 and the upper weekly Bollinger Band.
EURCAD is set to form the weekly Japanese candlesticks reversal pattern Shooting Star (strong sell signal) – if the pair closes this week near the current levels.
EURCAD is likely to fall further toward the next round support level 1.5240 (former resistance level from the start of 2019).
Related Articles

GBPCAD Wave Analysis 25 April 2024
April 25, 2024 @ 20:10 +03:00

GBPAUD Wave Analysis 25 April 2024
April 25, 2024 @ 20:09 +03:00

EURGBP Wave Analysis 24 April 2024
April 24, 2024 @ 21:42 +03:00

EURJPY Wave Analysis 24 April 2024
April 24, 2024 @ 21:40 +03:00