

Technical analysis
Cotton Wave Analysis – 28 January, 2020
January 28, 2020 @ 18:18 +03:00

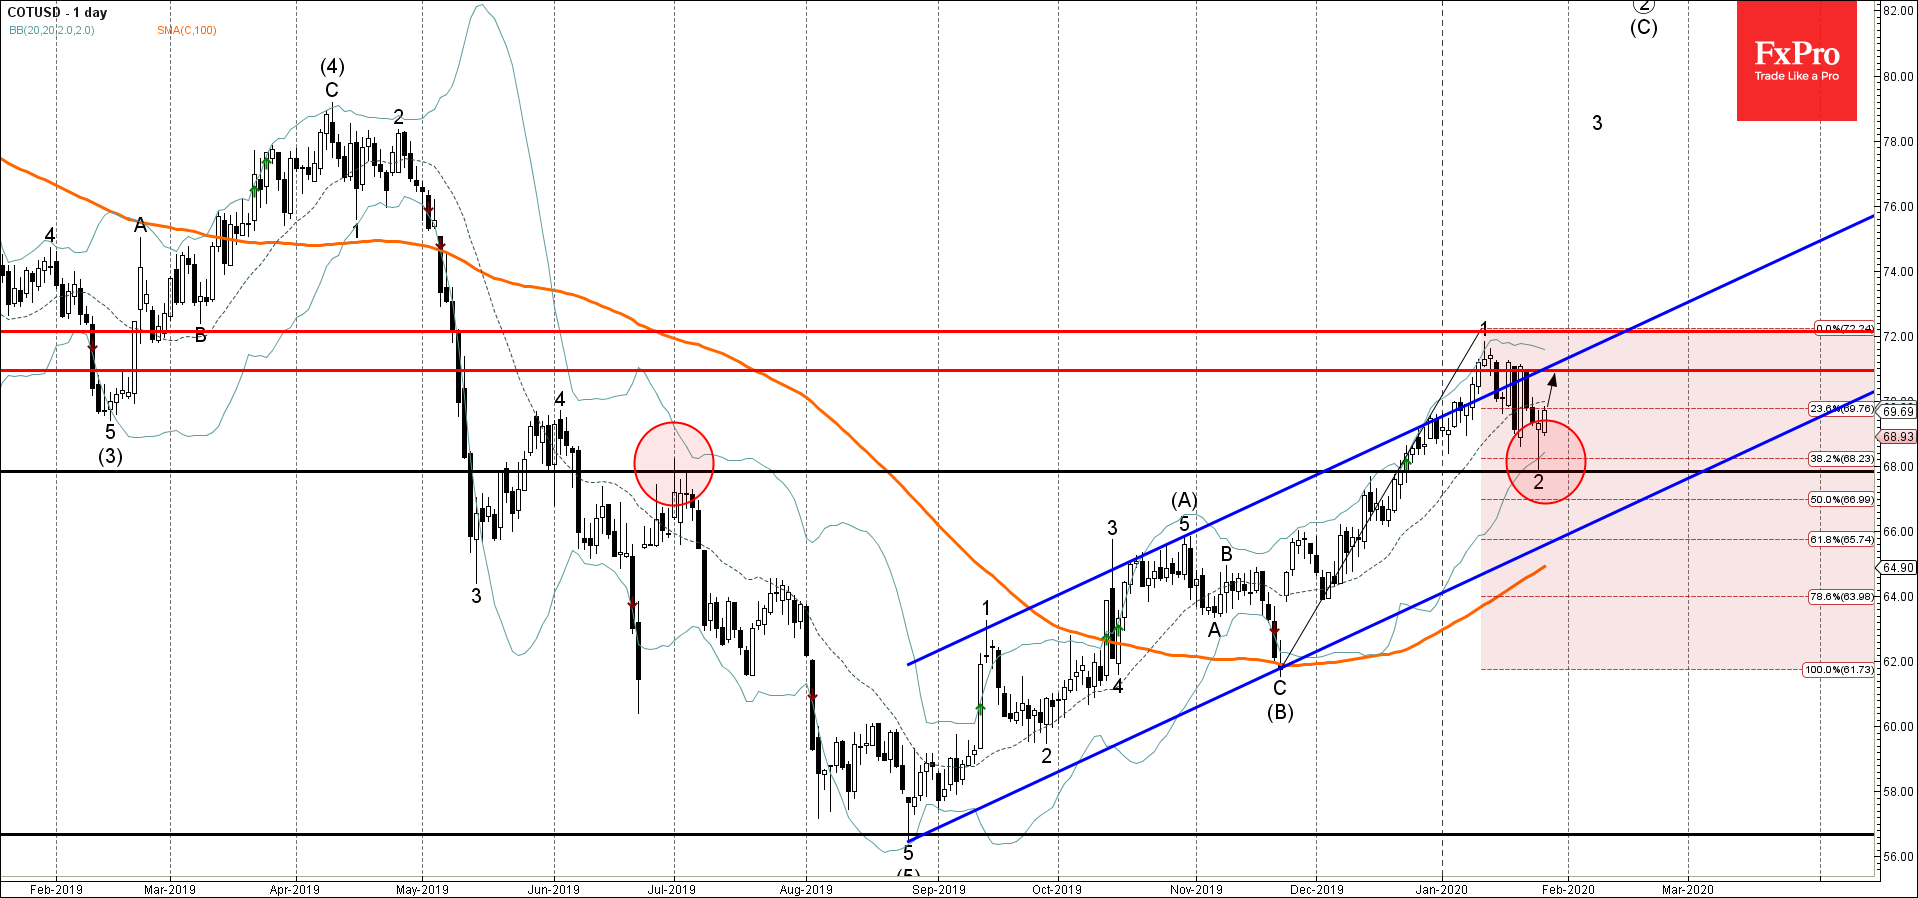
- Cotton reversed from support area
- Likely to rise to 71.00
Cotton recently reversed up sharply from the support area lying between the support level 68.00, lower daily Bollinger Band and the 38.2% Fibonacci correction of the previous sharp upward impulse 1.
The upward reversal from this support area created the daily Japanese candlesticks reversal pattern Hammer – which started the active impulse wave 3.
Cotton is likely to rise further toward the next resistance level 71.00 (which reversed the price multiple times earlier this month).
Related Articles

EURGBP Wave Analysis 24 April 2024
April 24, 2024 @ 21:42 +03:00

EURJPY Wave Analysis 24 April 2024
April 24, 2024 @ 21:40 +03:00

WTI crude oil Wave Analysis 23 April 2024
April 23, 2024 @ 22:47 +03:00

USDCAD Wave Analysis 23 April 2024
April 23, 2024 @ 22:46 +03:00